7.2. Looking at AJAX CommunicationsCommonly, when you get an error, it's caused by a small problem, and all you need to do to solve it is to look at what the client sent to the server and then look at the server's response. Some libraries provide logging mechanisms to record this information, and you can easily create a generic request logger using PHP, but I find tools that directly interact with my browser to be more effective. However, you don't always have access to these tools, or you may need to debug in a nondevelopment environment. In such cases, you'll want to know how to build a logger. 7.2.1. Building an AJAX LoggerTo build an AJAX logger, you first need to identify the information that is sent from the client. This information includes three types of information: query parameters, HTTP headers, and possibly a POST payload. In PHP, the query parameters are automatically parsed and made available in the $_GET variable; if the data sent to the server is a form submission, the POST variables are made available under a similar variable, which is $_POST. You can also read the raw POST submission by reading from php://input; this raw access is required to see the information if the client sent a JSON or XML payload. Finally, you can access the headers through the $_SERVER variable. Listing 7-1 shows an example of reading this information. Listing 7-1. read.php
The query parameters are the easiest inputs with which to work; the raw version is available as an index in the $_SERVER array (line 4), and that same data turned into an array is available through $_GET (line 5). POST data is available only when a POST HTTP request has been made. This can be done by using either a form or XMLHttpRequest. The raw POST header is read from php://input (line 8), and the parsed version is on line 9. $_POST is populated only when the POST has a Content-type of application/www-form-urlencoded or multipart/form-data. Reading the headers is a little harder because they are stored in $_SERVER along with a bunch of other data. The majority of the HTTP headers are prefixed with HTTP_, so we can display them by looping over $_SERVER and doing a regular expression match (lines 1317). This match will store the matching headers into an array. A couple of important HTTP headers don't have an HTTP prefix, so we look for the Content-type and Content-length headers using a secondary check (lines 1823). The examples for this chapter, which can be downloaded from the book's Web site, include a small test page (test.php) so that you can see the output of this script. The output for a GET request with a query, a form POST, and a POST from XMLHttpRequest are shown in Figures 7-1 through 7-3. Figure 7-1. A GET request with a query string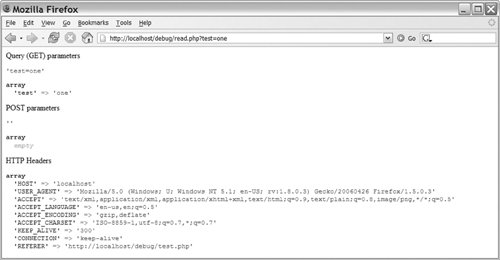
Figure 7-2. A form POST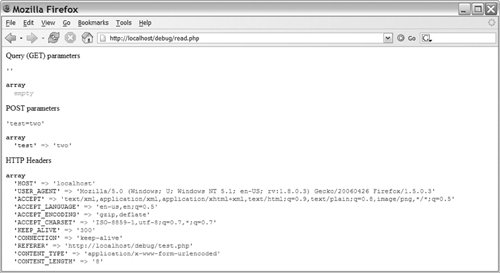
Figure 7-3. A POST request from XMLHttpRequest
To make this code usable for AJAX logging, we just need to format the output and add the ability to write it to a file. It's also useful to let the server code log what data it is going to send to the client. The final setup is a class called logger. It has two methods: storeServer, which sets the content we're going to send to the client, and write, which puts the information in a file. Listing 7-2 shows an example of a page that generates HTML chunks for an AJAX page. Listing 7-2. pageChunk.php
7.2.2. Using the LoggerAdding our logger is a fairly simple process. We include the logger class (line 2) and then create a new instance of it (line 4). When the logger instance is created, it automatically grabs the information from the client, so if the $_GET, $_POST, or $_SERVER variables are changed by other parts of the code, our logging is not messed up. Then, we start an output buffer (line 8). This will allow us to log what is being sent back to the client without changing any of our existing code. Lines 1016 contain some example input, and then we finish our logging process. Line 19 uses the ob_get_contents method to read all the output that has been created and to set it on our logger. Then, on line 20, we write out a log entry. The script ends by calling ob_flush (line 22), which sends out all the generated content we've been buffering. This simple logging process stores most of the details of an example entry from the log file, as Listing 7-3 shows. Listing 7-3. Log Entry
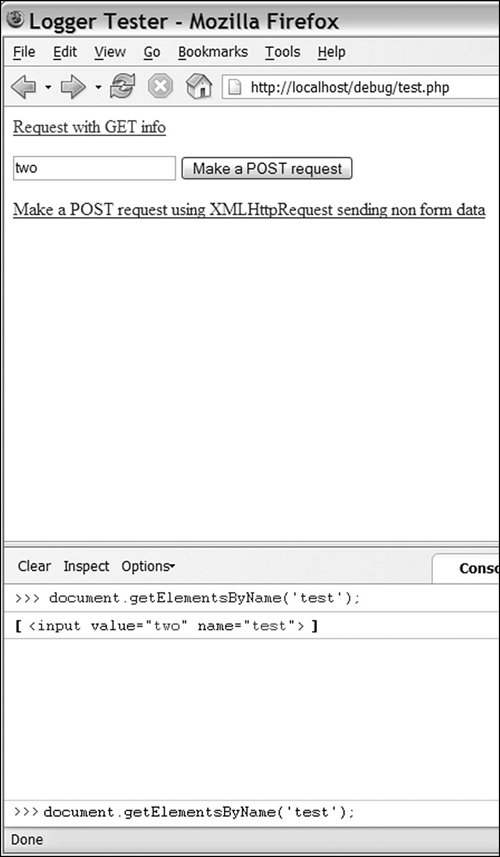
Logging like this is easy to build into the AJAX library that you are using (if it doesn't already have its own). It's easy because the process happens automatically. If you're using an HTML page chunk approach, you could also build it right into your framework; in that case, the logging could be done on a preconfigured set of pages, or it could be turned on by sending a custom header when you make a request using XMLHttpRequest. Logging like this is especially useful in large-scale testing or production environments in which you don't have access to the browser to see error messages. 7.2.3. Firebug: A Firefox Debugging ExtensionWhile logging provides you with a lot of information, it's not the most efficient way to get the information you need. It means keeping another file open and parsing through large text entries for the required information. Logging also doesn't have access to what is happening to the JavaScript on the browser, so it doesn't contain the full picture. Tools that can be added to the browser can get around most of these problems and have the ability to offer you a rich user interface. If you're using Mozilla Firefox, extra functionality can be added to your browser through the use of an extension. The Firebug extension (www.joehewitt.com/software/firebug/) adds a popup bar at the bottom of the browser that lets you see JavaScript errors. With it, you can also view details of each XMLHttpRequest request, inspect DOM elements, and run JavaScript commands against the current page. An installation link is available from the project's Web site. The basic interface is shown in Figure 7-4. Figure 7-4. Firebug: a Firefox debugging extension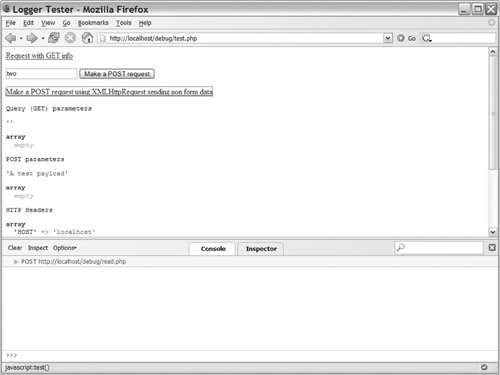
Firebug attacks the debugging process from the JavaScript side. Whenever a JavaScript error happens, an error icon is shown in the lower-right corner (see Figure 7-5). Clicking this icon will bring up the console, showing you the errors. In its default configuration, these errors include errors generated by CSS, the browser, and its extensions (see Figure 7-6). To limit the displayed errors to just JavaScript ones, use the Errors drop-down box to deselect Show Errors From Chrome and Show CSS Errors. You can also get to the dialog box even when an error hasn't happened by clicking the error icon in the lower-right corner (see Figure 7-7). Doing this gives you an easy way to get to the XMLHttpRequest inspector. Figure 7-5. Firebug error icon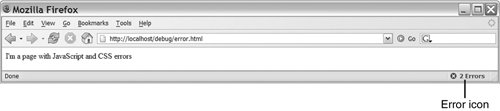
Figure 7-6. Firebug error selector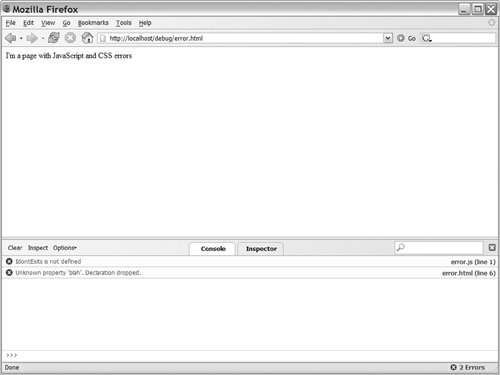
Figure 7-7. Firebug status icon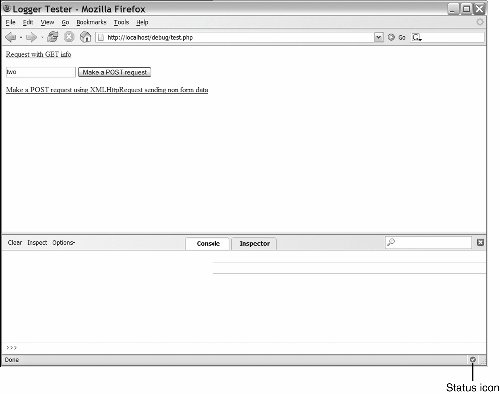
The XMLHttpRequest inspector lets you see the POST payload that was sent to the server, the response from the server, and the properties of the XMLHttpRequest object that sent it. A new row is added to the Firebug pane each time a request is made using XMLHttpRequest, so you can also use it as an overview of your AJAX activity. Each request entry includes the HTTP request type (generally GET or POST) and the URL to which the request was made. Figure 7-8 shows Firebug with several requests in it. Figure 7-8. Firebug with multiple XMLHttpRequest entries
Now if you have a request that isn't working as expected, you can start the debugging process by doing the following:
Depending on the configuration of the server, you may see a large number of headers returned with the data, as in Figure 7-9. The most important ones are Content-type and Set-Cookie. Content-type has to be set to text/xml for XML-based requests to work. Many libraries also use this header to determine if the server is sending JSON that the library needs to decode, or if the content is just plain HTML. The Set-Cookie headers mark which cookies were set on this request; you can use them to verify that new authentication or other cookies were set as needed. Figure 7-9. Firebug showing the Headers tab of an XMLHttpRequest entry; the important fields are outlined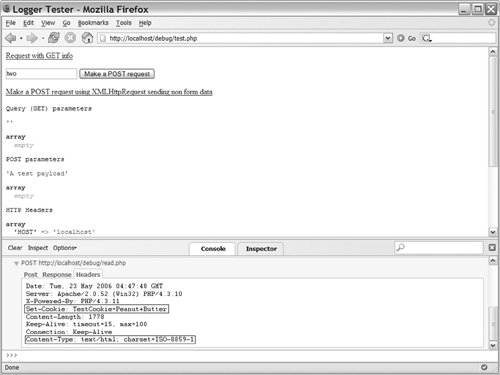
Firebug also has the capability to run any JavaScript command against the current page. To do this, type a JavaScript command such as document.getElementByName('test').style.color = 'red'; into the field at the bottom of the page (see Figure 7-10). You can also inspect page elements, get layout information, and view all elements, DOM properties, and events (see Figure 7-11). These features are useful in the overall development processes, but the biggest aid to debugging AJAX requests is the XMLHttpRequest inspector. Figure 7-10. Running a JavaScript command in Firebug
Figure 7-11. Inspecting a DOM element with Firebug
7.2.4. FiddlerIf you develop in Internet Explorer or just need to track down an Internet Explorer-specific bug, you obviously won't be able to use Firebug, but there still are a number of useful tools to help you. One tool is Fiddler, which is an HTTP debugging proxy that lets you see each request made by Internet Explorer and the response it receives from the server. Because it is an external tool, it can't look at the JavaScript the way Firebug can, but it does have an easy-to-use interface and it does give you an easy-to-use view of each request. You can download Fiddler from www.fiddlertool.com/; this Web site also includes a wealth of information on how to use its advanced scripting and transformation features. Once you have it installed, you just need to run it, and Internet Explorer will automatically be set up to use it. You can also use it with other browsers by setting them up to use Fiddler as an HTTP proxy. You just set the proxy host to localhost and the port to 8888. An example of setting up the proxy in Firefox is shown in Figure 7-12. Figure 7-12. Setting up Firefox to use Fiddler as its proxy
Once you've run Fiddler, open your browser and perform the request that is giving you problems. Each HTTP request is shown as an entry in the main pane; secondary requests for images and CSS files will be shown with gray text, and the two HTML pages will be shown in blue. You can clear entries from the pane by right-clicking them and selecting remove. The basic session browsing interface is shown in Figure 7-13. Figure 7-13. Main Fiddler interface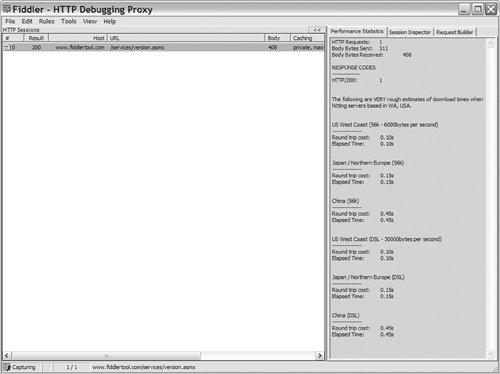
Once you've identified the HTTP request you want to inspect, select it in the sessions pane on the left side and then look at the pane on the right side. This pane has three main tabs. For debugging purposes, the most useful tab is the Session Inspector. After you select the Session Inspector tab, the pane will be split into two sections: the top showing the information that was sent to the server and the bottom showing the server's response (see Figure 7-14). For both the request and the response, you can view the request in a number of different formats, the most useful being the Headers and TextView views. If you're using XML to move data between the client and the server, you will also find the XML view to be useful because it will show the XML data in a formatted display. Figure 7-14. Fiddler session Inspector interface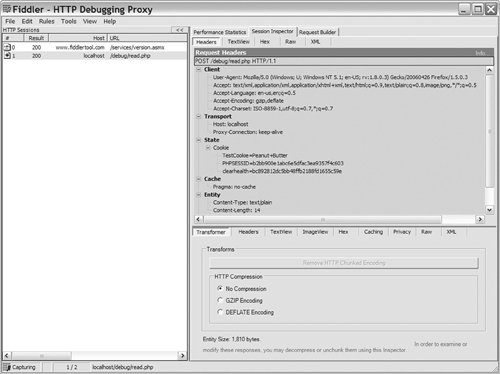
The Headers view shows you a formatted version of the HTTP headers used in the request (see Figure 7-15). You can use this view to verify cookies are being sent, to see the Content-type of the data, and to view any HTTP status codes. The online help gives more details, but outside of verifying expected Content-types, you shouldn't need to spend much time here. The TextView view shows you the content that was sent to the server in a POST request and the results that the server sent back. The view offers the ability to search the content inline (the blue Find bar) and to open another program, such as your favorite text editor. (The open with command is the button to the right of the blue Find bar). You can see an example of the TextView in Figure 7-16. Fiddler offers a number of other features, which are useful for transforming the request and responses, but they are not all that useful in basic AJAX debugging situations. Figure 7-15. Fiddler Headers view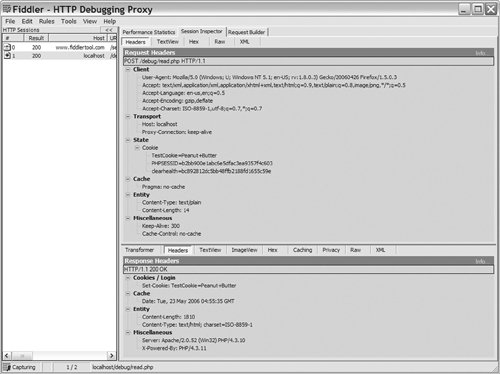
Figure 7-16. Fiddler TextView view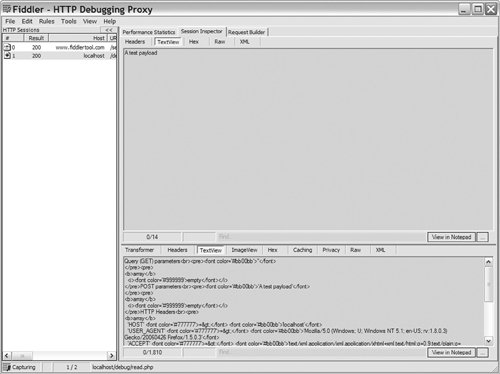
7.2.5. General Debugging ScenariosFirebug, Fiddler, and custom logging code all provide extra information about an AJAX request. These types of tools are useful in scenarios in which you make an AJAX request and the request dies without giving useful information to your JavaScript code. In most cases, looking at the response from the server will quickly point out the problem. It could be an error in your server code or just some unexpected data being returned. Debugging tools such as Fiddler or Firebug can help you figure out what data you're sending to the server. This can be especially useful once you start using more complex JavaScript widgets and AJAX libraries. These libraries offer a lot of functionality, but they move the AJAX operations far away from the actual event. This can make it hard to see what is really happening, so by using a tool like Firebug or Fiddler, you can see the HTTP request that was sent to the server and know what is really going on. |