10.1. Overview of the Sun Rise and Set Data ViewerIn this chapter, we look at a specific case that illustrates the general problem of slow data display. Our case is a small PHP and HTML site that displays the data for the time that the sun rises and sets in various cities. The page includes a graph of a full year of this data, and it includes a table that shows one month of the data. The overall layout of the site is shown in Figure 10-1. Many times, when you display large amounts of data in a table, you use a user interface (UI) element called a pager. A simple example of this is shown in Figure 10-2. This sun rise and set viewer uses a simpler version of this because the data can easily be divided into months. The pager for the viewer (see Figure 10-3) divides the data set by month and puts all the options in a drop-down widget because the number of possible pages is only 12. Figure 10-1. Basic site interface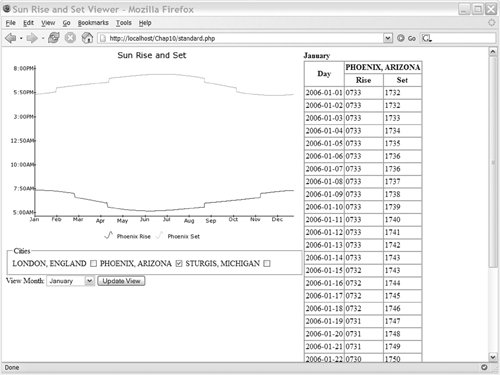
Figure 10-2. Example pager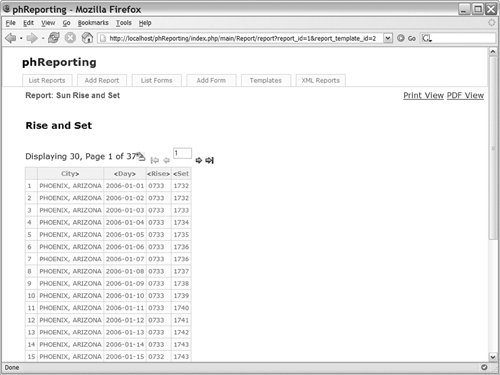
Figure 10-3. Month selector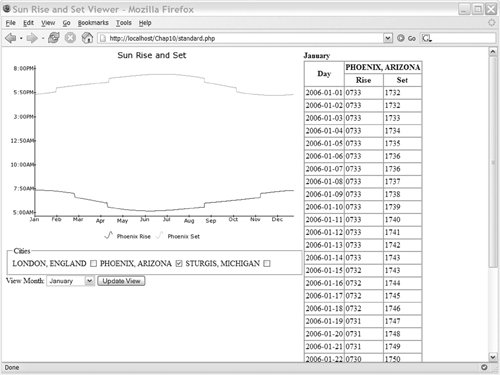
|