10.3. Problems with the Non-AJAX ViewerNow that we've implemented the viewer, we can see that it has a number of problems. The first problem is performance. Generating the graphespecially for a large number of citiescan take three to five seconds. This is further aggravated by the fact that obtaining a new set of monthly data takes a page reload. It might be possible to eliminate some of this performance penalty though caching or other graphing speedups, but that's not a reusable solution, and if we would add any more interactive features, such as highlighting a day on the graph, the caching would be unworkable. The viewer also gives poor user feedback because of how the browser handles loading the slow images. In Internet Explorer, the user will see an empty box where the image will be shown (see Figure 10-4), whereas in Firefox, the old image will be shown until the reload finishes. Firefox's behavior around image loading (see Figure 10-5) is especially problematic because it makes the page look like it's done loading even though the cursor still has a loading icon and is waiting for the graph to finish loading. Figure 10-4. Internet Explorer's slow image-loading behavior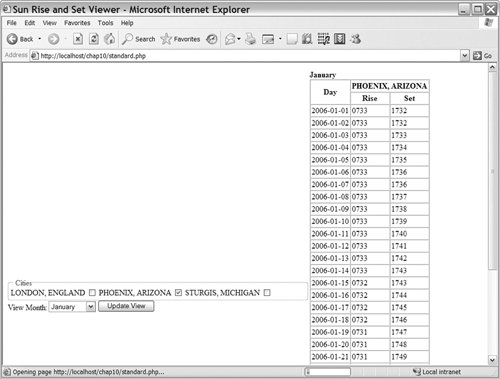
Figure 10-5. Firefox's slow image-loading behavior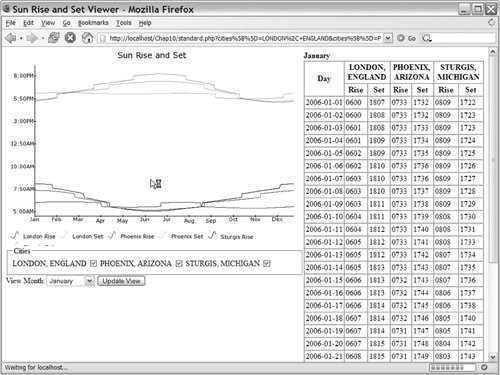
|