Three report section events—Format, Retreat, and Print—can help you create dynamic formatting and content in a report. Other report events that can help you build smart reports include Open, Close, No Data, and Page. These events can also help you manage the application's behavior before, during, and after the opening of a report. You can use combinations of report events to create report formatting and special effects.
Use the Open event to programmatically set properties for reports and their controls. This is the first event that fires when a report is opened. When creating conditional formats for a specific instance of a report, use an Open event procedure to instantiate your FormatCondition objects and assign properties to them. If your application can have more than one report open at the same time, you can use the Activate and Deactivate events to monitor the flow of focus to and away from a report. Use the Close event to perform special actions just before a report closes, such as opening a form or presenting a message box.
You use the NoData event to detect a report that has no data in its record source. This event occurs after Access formats a report for printing. Your application can use this event to cancel a report that is about to print without any data. You can also program event procedures that prompt a user to enter data in the underlying record source or to select a different record source for the report.
The following sample formats a report using the Print event for various report sections. The Print event occurs after formatting for each section is complete but before the report actually prints. Each report section can have its own Print event procedure, and the event occurs each time Access works with that section to prepare the report. For example, the Report Header Print event occurs just once, unless a Retreat event forces Access to return to the Report Header section. The Retreat event enables Access to manage special report requirements, such as keeping a group together. In contrast to the Report Header section, the Detail section occurs at least once for each row in the record source for a report.
Figure 6-24 shows a report that uses the Print event for three sections to add red rectangles around the Report Header section and the Page Footer section. Note the different thicknesses of the rectangular borders. The Detail section displays an oval around all monthly order totals greater than or equal to 30.
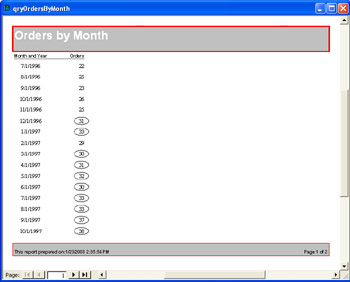
Although the Report Header Print event occurs once per report and the Page Footer Print event occurs just once per page, the Detail section Print event occurs once for each row on a page. This means that for the page shown in Figure 6-24 the Detail section fires the Print event 16 times. With each event, your application can examine control values for the current record. Therefore, you can selectively display ovals around monthly order totals.
The code for the report in Figure 6-24 comprises the following three event procedures. Your applications can apply the Line method (as in the Report Header and Page Footer event procedures) to draw a rectangle around the report section. The first four arguments of the Line method have a data type of Single and are used to indicate two pairs of coordinates for the line. These four values specify the top, left, width, and height values for a rectangle in twips, which is the default metric for the Line method. The ReportHeader_Print procedure sets these parameters to the appropriate measurements for the Report Header section.
Another argument of the Line method has a Long data type and designates the color of the rectangle's border. The sample uses the RGB function to designate a number that represents the color red in the lngColor variable. Just before invoking the Line method to draw the rectangle, the ReportHeader_Print procedure assigns a value to the report's DrawWidth property. This property always uses pixels. Therefore, the border around the Report Header section is 25 pixels. The Line method's closing argument, B, instructs the method to draw a rectangle or box using the two coordinates mentioned earlier as diagonally opposite endpoints.
Private Sub PageFooterSection_Print(Cancel As Integer, _
    PrintCount As Integer)
Dim sngTop As Single, sngLeft As Single
Dim sngWidth As Single, sngHeight As Single
Dim lngColor As Long
Const conPrinterFudge = 25

'Set top, left, width, and height
'conPrinterFudge accounts for printer-specific
'variation of content placement near page edges
    sngTop = Me.ScaleTop
    sngLeft = Me.ScaleLeft
    sngWidth = Me.ScaleWidth - conPrinterFudge
    sngHeight = Me.ScaleHeight - conPrinterFudge
   'Set color
    lngColor = RGB(255, 0, 0)

'Draw line as a box
    Me.Line (sngTop, sngLeft)-(sngWidth, sngHeight), lngColor, B

End Sub

Private Sub ReportHeader_Print(Cancel As Integer, PrintCount As Integer)
Dim sngTop As Single, sngLeft As Single
Dim sngWidth As Single, sngHeight As Single
Dim lngColor As Long

'Set top, left, width, and height
    sngTop = Me.ScaleTop
    sngLeft = Me.ScaleLeft
    sngWidth = Me.ScaleWidth
    sngHeight = Me.ScaleHeight

'Set color
    lngColor = RGB(255, 0, 0)

'Draw line as a box
    Me.DrawWidth = 25
    Me.Line (sngTop, sngLeft)-(sngWidth, sngHeight), lngColor, B

End Sub

Private Sub Detail_Print(Cancel As Integer, PrintCount As Integer)
Dim sngHCtr As Single, sngVCtr As Single
Dim sngRadius As Single

'Position and size circle
    sngHCtr = (Me.ScaleWidth / 2) - 3670
    sngVCtr = (Me.ScaleHeight / 2) - 20
    sngRadius = Me.ScaleHeight / 1.5

'Conditionally draw circle; last argument sets aspect ratio
    If Me.CountOfOrderID.Value >= 30 Then
        Me.Circle (sngHCtr, sngVCtr), sngRadius, , , , 0.5
    End If

End Sub
The only differences between the ReportHeader_Print and PageFooter_Print procedures are the line setting the width of the rectangle's border and the offset factor to position the rectangle on a page. The Report Header section uses a width of 25 pixels, but the Page Footer section draws a rectangle with the default width of 1 pixel. This is the default value for the DrawWidth property. Both procedures draw a rectangle on a layer in front of the standard report layer. You can see that the red border from the Line method appears above the background shading for the report title. The conPrinterFudge constant is a printer-specific value in twips. Sometimes when you get near the edge of a page in an Access report, placement can depend on the printer. For the printer I used when testing the samples for this book, I needed an offset of 25 twips. A value of 0 caused the right and bottom lines of the rectangle for the Page Footer section to print off the page. You can determine the appropriate conPrinterFudge value for a specific printer through trial runs.
The Detail section's event procedure relies on the Circle method to draw an oval around the order totals for each row in that section. You must empirically determine horizontal and vertical centers as well as the radius of your circle. Use an aspect ratio argument in the Circle method to transform a circle to a long or narrow oval. Like the Line method, the Circle method draws its output on a layer in front of the standard report layer. Embedding the Circle method in an If…Then statement allows the procedure to draw the oval conditionally around some—but not all—Orders field values. The previous sample draws ovals around any orders greater than or equal to 30 in a month.
The application of the Circle method in the preceding sample illustrates a traditional technique for distinguishing values on a report. However, FormatCondition objects offer a newer approach that synchronizes with the Access user interface. Your clients are likely to request conditional formatting because Access users can readily implement such formats from the user interface.
The excerpt of a sample report shown in Figure 6-25 (rptOrdersbyMonthConditionalFormat) illustrates the use of ConditionalFormat objects with one other feature. Basically, the report prints monthly order totals in either of two colors. Each color corresponds to a FormatCondition object. The second feature makes the application of these contrasting colors dynamic. Just before the report opens, the application prompts the user for a cut-off value. Values below the cut-off criterion appear in red, otherwise they are green. By rerunning the report with different criterion values, users can change which values appear in red and which appear in green. As a reminder, the report documents the criterion a user entered in its Report Header section.
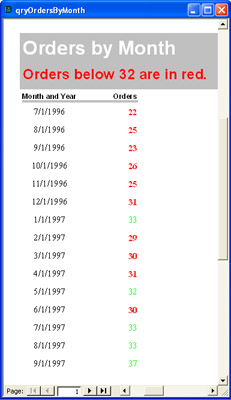
If you instantiate FormatCondition objects in a report's Open event, you need instantiate them only once. The FormatCondition objects remain in effect until the report closes. If a report already has conditional formats set through the Access user interface, the FormatCondition objects add to the existing objects. Because you can have only three FormatCondition objects at any time, you might need to manage the number of active FormatCondition objects. The FormatConditions collection offers a Count property that tells you the number of active conditional formats, and the FormatCondition object has a Delete method that enables you to remove a conditional format. See "Programming Conditional Formats" in Chapter 5 for more code samples containing FormatCondition objects.
The Open event procedure for the report excerpted in Figure 6-25 follows. An InputBox function prompts for a minimum sales target. Monthly order totals less than the minimum criterion that a user enters appear in red. The procedure assigns a caption value to document the criterion in effect for any printing or viewing of the report. Next, the procedure adds the first FormatCondition object, which applies to values greater than or equal to the criterion. Then, the focus shifts to the addition of the second FormatCondition object for values less than the criterion. Notice that the RGB function assigns the number for the color red to this FormatCondition object's ForeColor property.
After adding the FormatCondition objects through the frc1 and frc2 object references, the procedure can safely remove the object references from memory. Their purpose was to set the conditional formats for the CountOfOrderID control. The conditional formats remain in effect until the report closes.
Private Sub Report_Open(Cancel As Integer)
Dim frc1 As FormatCondition
Dim frc2 As FormatCondition
Dim int1 As Integer
Dim str1 As String

'Prompt for criterion value for color assignments, and
'update the lblTarget control caption
int1 = CInt(InputBox("What's the minimum sales target?",  _
    "Programming Microsoft Access 2003", 30))
str1 = "Orders below " & int1 & " are in red."
Me.lblTarget.Caption = str1

'Condition for values greater than or equal to criterion;
'format is green
Set frc1 = Me.Controls("CountOfOrderID"). _
    FormatConditions. _
    Add(acFieldValue, acGreaterThanOrEqual, int1)
frc1.ForeColor = RGB(0, 255, 0)

'Condition for values less than criterion;
'format is bold, red
Set frc2 = Me.Controls("CountOfOrderID"). _
    FormatConditions. _
    Add(acFieldValue, acLessThan, int1)
frc2.FontBold = True
frc2.ForeColor = RGB(255, 0, 0)

'Clean up objects
Set frc1 = Nothing
Set frc2 = Nothing

End Sub
If your report requires totaling the entries on a report page, you must program these page sums using event procedures because Access offers no built-in way to do this. The sample we'll examine uses a text box with its Running Sum property set to Over All. This setting causes the text box to total its Control Source field over the whole report. Figure 6-26 shows the first and second pages of a report that contains an extra column for computing the running sum. The far-right column appears for tutorial purposes, but in practice, you'll set the Visible property for the control with the running sum to False. This sample gives you a way to show or hide this column through compiler constants and the report's Open event procedure. The second page of the report, which is shown in Figure 6-26, appears without the running sum column.
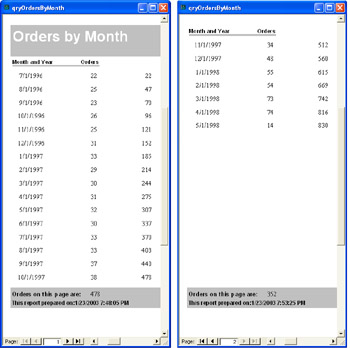
You can compute page sums with as few as two event procedures (shown next). Public declarations make the variables conveniently available in either of the event procedures. The PageFooterSection_Format event procedure requires only two lines. First, it copies the value for the pagesum control with the running sum to lngCurrentRSum, a memory variable. Then, it sets another text box in the Page Footer section (txtpagesum) to the difference between lngCurrentRSum and lngLastRSum. The value of lngLastRSum is initially 0. After every page finishes formatting, a procedure firing with the report's Page event copies the current value of lngCurrentRSum into lngLastRSum. Therefore, the difference between lngLastRSum and lngCurrentRSum in the Report_Page event procedure is the page sum for the current page.
Public lngLastRSum As Long
Public lngCurrentRSum As Long
Public lngPageRSum As Long

Private Sub PageFooterSection_Format _
    (Cancel As Integer, FormatCount As Integer)
    lngCurrentRSum = Me.pagesum
    Me.txtpagesum = lngCurrentRSum - lngLastRSum
End Sub

Private Sub Report_Page()
    lngLastRSum = lngCurrentRSum
End Sub

Private Sub Report_Open(Cancel As Integer)
#Const ShowRunningSum = False

#If ShowRunningSum = True Then
    Me.pagesum.Visible = True
#Else
    Me.pagesum.Visible = False
#End If

End Sub
Notice that the PageFooterSection_Format event procedure in the sample computes and displays page sums by writing a value into a text box within the Page Footer section. Print event procedures do not allow this kind of manipulation because the Print event fires after the report is already formatted. The Format event fires as your application formats the report.
The Open event procedure lets you manage the visibility of the text box that assists with the computation of the running sum. The value of ShowRunningSum, a compiler constant, is set to True in the sample. Change this value setting to False to hide the pagesum text box. Regardless of whether the text box is visible, it will participate in the computation of the page sums.