A PivotTable summarizes and analyzes data in a datasheet. The datasheet for a PivotTable contains several sections known as drop areas into which you can deposit fields. A field can correspond to a column in a relational table from an Access database file or from a Microsoft SQL Server database. The PivotTable user interface (UI) and programmatic interface simplify computing statistics for the data in the detail drop area based on fieldsets in the row and column drop areas. (A fieldset is a collection of related fields.) PivotTables offer a generalized way to perform cross-tabulations of relational data. In addition, you can readily filter the data that appears in a PivotTable's datasheet.
The great thing about the widespread availability of PivotTables in Access is that programmers no longer have to transfer their output to Excel for their clients to view it in this format. PivotTables enable more end users to perform analyses with the data provided by programmers. Furthermore, the ease with which end users can manipulate data with a PivotTable increases the demand for the services of database programmers who understand how to create and manage PivotTables programmatically.
Just as you can with PivotTables, you can move PivotChart fields from one drop area to another. A PivotChart will automatically update as you move fields to and from its drop areas. You can also readily update the graph type of a PivotChart. Access 2003 offers 12 major graph types from which you can choose, including column, line, pie, and area charts. Each category of graph offers several subtypes of charts you can select from. Unlike the Microsoft Graph 2000 Chart ActiveX control, an Access PivotChart does not force you to work with an OLE DB object outside of Access.
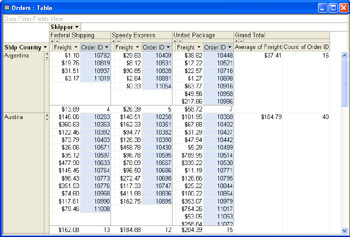
Figure 7-1 presents an excerpt from a sample PivotTable based on the Orders table imported from the Northwind database. The Chapter07.mdb file includes this table along with several others from the Northwind database. The PivotTable displays the freight and order ID information according to the ship country and shipper. As you can see, the Ship Country and Shipper fieldsets organize the two detail fieldsets, Freight and Order ID. The entries at each intersection of a country and a shipper are the freight charges and order ID values for orders transported to a country by a shipper.
In addition to listing raw values, the PivotTable also presents the average freight charge and the count of order IDs. These average and count values appear within the cell at the intersection of each country and shipper as well as in the Grand Total columns at the right edge of the PivotTable. The values in the pair of Grand Total columns for each row represent the data for all shippers for a particular country. The final row in the PivotTable, which is also named Grand Total, displays the average freight charge and order count for each shipper for all countries. By default, both the Grand Total row and column hide the detail freight charges and order IDs. A user can show and hide these detail values with the Show/Hide Details controls that appear as a plus sign (+) and a minus sign (- ) within each row or column of a fieldset, including the Grand Total fields. In addition, the toolbar controls in the PivotTable view enable you to expand and contract detail for the entire table. Move the cursor over the toolbar controls to see the ToolTips that indicate which controls support these actions.
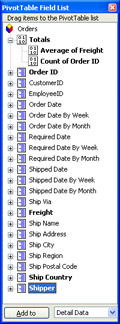
A Field List control on the toolbar in the PivotTable view determines the visibility of the PivotTable Field List control. (See Figure 7-2.) This dialog box displays the list of all items available for inclusion in the PivotTable. Items that the PivotTable currently contains appear in a bold font; items not contained in the PivotTable appear in a normal font. The Order ID, Freight, Ship Country, and Shipper fields are boldface because the PivotTable currently contains them. In addition, the Average of Freight and Count of Order ID fields appear in boldface within the Totals fieldset at the top of the dialog box.
As you've likely gathered, PivotTables work with fieldsets (this topic is examined in more detail later in this chapter). When working with relational tables as data sources, your fieldsets almost always will contain just one field. However, Access automatically breaks date/time field values into hierarchically dependent fieldsets. Expand the Order Date By Month fieldset to see the nested fields that Access automatically makes available to you. Of course, you do not have to work with these hierarchical collections of fields. The PivotTable Field List control offers a fieldset item named Order Date that has a single item below it as its sole field—also named Order Date.
The Ship Country, Freight, and Order ID fieldset values each corresponds exactly to a matching column value in the Orders table, which is the source for the PivotTable in Figure 7-1. In contrast, the Shipper fieldset values show shipper names, but the matching column, Shipvia from the Orders table, has numeric values instead of names. An expression for the Shipper fieldset transforms the numbers in the Shipvia column to shipper names. You can view the transformation expression by right-clicking Shipper in the PivotTable and choosing Properties. Then, click the Calculation tab in the Properties dialog box to view the expression for the fieldset. The formula for converting the Shipvia numeric values to shipper names follows:
IIf(Shipvia=1, "Speedy Express", IIf(Shipvia=2, "United Package", "Federal Shipping"))
| Note |
A calculated field, such as Shipper, appears in the Field List dialog box only in the PivotTable session initially defining the fieldset. Use the PivotTable, Calculated Totals and Fields, Create Calculated Detail Field command to create the calculated Shipper fieldset. You can view the properties for the Shipper fieldset by right-clicking the item on the PivotTable and choosing Properties. |
As we've discussed, a PivotTable is a view for standard database objects in Access 2003. Therefore, you use the View control on a toolbar to expose the template for constructing and editing a PivotTable. If a database object has no previously saved PivotTable view, you will see a blank template. This template contains four drop areas into which you can place fieldsets. Click the Field List control on the toolbar in a PivotTable view to open the PivotTable Field List dialog box. The Field List control in a PivotTable view looks identical to the Field List control in a Form Design view. This control exposes all the built-in fieldsets for a database object along with any calculated fields or Totals fields. You can add items to a PivotTable by dragging them from the dialog box to a drop area. To remove items from a PivotTable, drag them from the drop area right off the table.
| Note |
For analysts, one of the major benefits of PivotTables is that you can drag items from one drop area to another. A PivotTable automatically recomputes after an item assumes its new position. |
Figure 7-3 shows a PivotTable along with a PivotTable Field List dialog box for the Products table. Three of the four PivotTable drop areas are empty. These empty drop areas have names of Totals Or Detail Fields, Column Fields, and Filter Fields. A message