Creating a Report in Design View
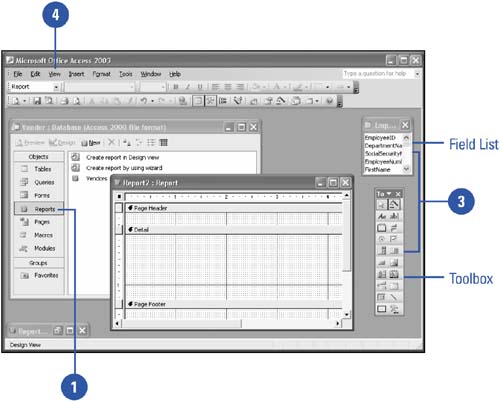
When you create a report from scratch in Design view, three sections appear: Page Header, Detail, and Page Footer. Once you create the report, you need to populate it with data. You can add bound controlsfields of data from a table or querydirectly from the Field List, or you can add other types of unbound controlstext boxes, labels, pictures, buttons, and so onfrom the Toolbox. In Design view, you can see two parts for every control: the control itself and its corresponding label. When you move a control, its corresponding label moves with it.
Create or Modify a Report in Design View
 | In the Database window, click Reports on the Objects bar, and then click New, or click a report, and then click Design; skip step 2. |
 | In the New Report dialog box, click Design View, select the table or query on which to base the report, and then click OK. |
 | Use the Toolbox and Field List to create or modify a report in Design view. |
 | To view or hide headers and footers, click the View menu, and then click Report Header/Footer or Page Header/Footer. |
|
You can display or hide display boxes.
When you create a report in Design view, three boxes might appear: the Field List box (where you can add bound controls), the Toolbox (where you can add unbound controls), and the Sorting And Grouping box. You can hide or view these boxes by clicking their corresponding buttons on the Report Design toolbar. |
Add a Bound Control
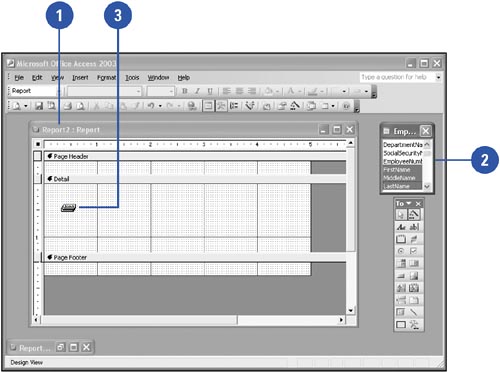
| Display the report in Design view. |
| Select the fields you want to include from the Field List; press Shift or Ctrl while you click to select multiple fields. |
| Drag the selected field or fields to the section in which you want the field to appear. Two boxes appear for each field: one containing the label and one for the field values. |
Add an Unbound Control
| Display the report in Design view, and then click the Toolbox button for the control you want to add, such as a text box, a horizontal line, or a shape. |
| Drag to draw a box in the location where you want the control to appear. |
|
You can display or hide the ruler and grid.
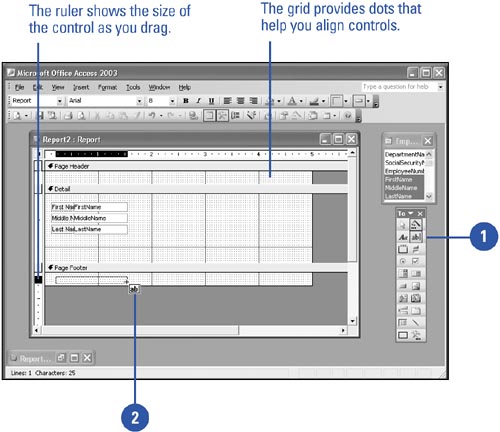
The ruler and grid provide guides to help you arrange your controls. Click the View menu, and then click to select Ruler or Grid.
You can create an unbound report.
Create a report without choosing a table or query on which it is based. Such reports are called unbound reports. A dialog box is an example of an unbound report. |
|