| [ Team LiB ] |
|
Types of ReportsThe reporting engine of Microsoft Access is very powerful and has a wealth of features. Many types of reports are available in Access 2003:
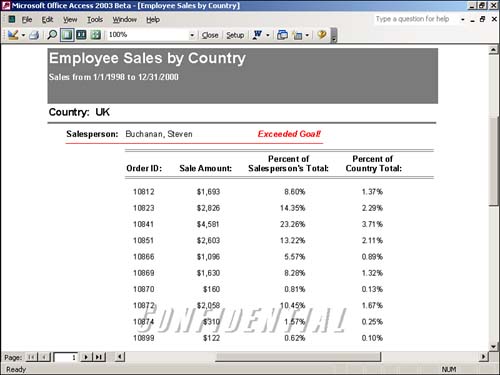
Detail Reports
Figure 12.1. An example of a Detail report.
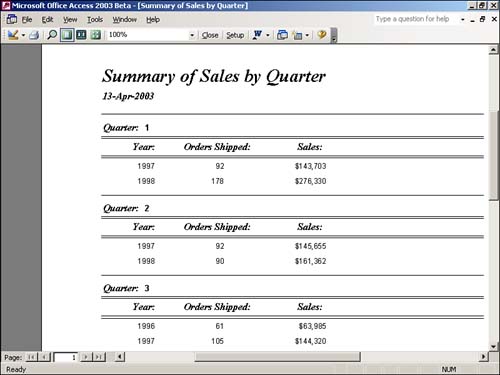
Summary Reports
Figure 12.2. An example of a Summary report.
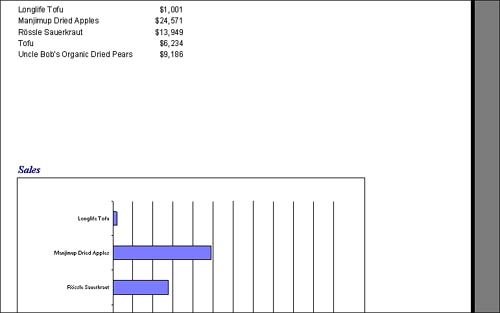
Reports Containing Graphics and ChartsAlthough the statement "A picture paints a thousand words" is a cliché, it's also quite true: Research has proved that a person retains data much better when it's displayed as pictures rather than numbers. Fortunately, Access makes including graphics and charts in reports quite easy. As shown in Figure 12.3, you can design a report to combine both numbers and charts. The report in Figure 12.3 shows the sales by product, both as numbers and as a bar chart. The main report is grouped by product category and contains a subreport based on a query that summarizes sales by CategoryID, CategoryName, and ProductName for a specific date range. The chart totals product sales by product name, displaying the information graphically. You can include photographs, clip art, hand-drawn graphics, charts, and more within the reports you create. Figure 12.3. An example of a report with a chart.
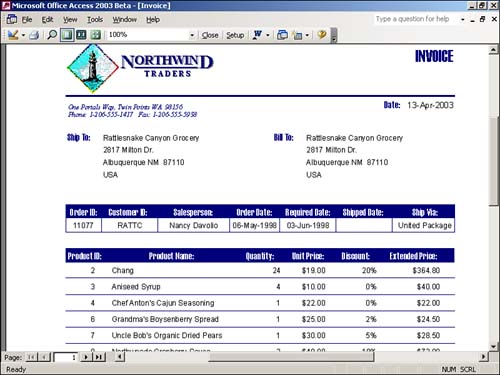
Reports Containing FormsUsers often need reports that look like printed forms. The Access Report Builder, with its many graphical tools, allows you to quickly produce reports that emulate the most elegant data-entry forms. For example, the report shown in Figure 12.4 produces an invoice for a customer. This report is based on a query that draws information from the Customers, Orders, Order Details, Products, Employees, and Shippers tables. The report's Filter property (covered in Hour 2) is filled in, limiting the data that appears on the report to the last six records in the Orders table. Using graphics, color, fonts, shading, and other special effects gives the report a professional look. Figure 12.4. An example of a report that contains a form.
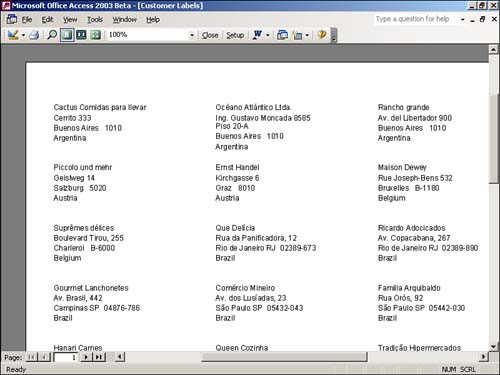
Reports Containing LabelsCreating labels such as mailing labels in Access 2003 is easy when you use the Label Wizard. Labels are simply a special type of report with a page setup that indicates the number of labels across the page and the size of each label. An example of a mailing label report created by using the Label Wizard is shown in Figure 12.5. This report is based on the Customers table but could just as easily be based on a query that limits what mailing labels are produced. Figure 12.5. An example of a report containing mailing labels.
|
| [ Team LiB ] |
|