Saving PivotTables and PivotCharts to Data Access Pages
Access allows you to easily add PivotTables and PivotCharts to the data access pages that you create. Here's the process:
From the Database window, click Pages in the list of objects. Double-click the Create Data Access Page in Design View item. Activate the field list. Click and drag a table or query to the data access page. The Layout Wizard appears (see Figure 19.27).
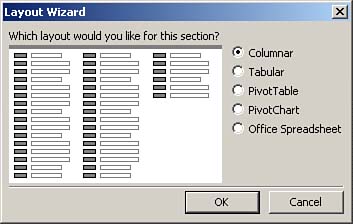
Select PivotTable and click OK. If you based the data access page on a query and the query required parameters, the Enter Parameters dialog box appears (see Figure 19.28).
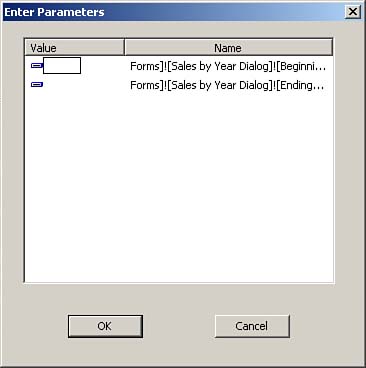
Click OK. Access adds the PivotTable to the data access page (see Figure 19.29). The PivotTable appears as a control on the data access page.
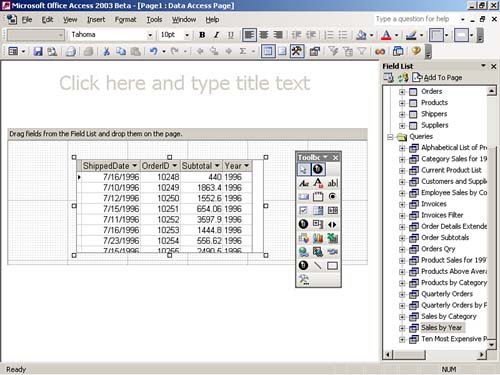
Right-click the control and select Commands and Options from the context menu. The Commands and Options dialog box appears (see Figure 19.30). Click the Behavior tab.
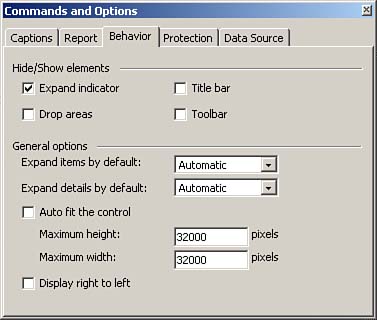
Select the Drop Areas and Toolbar check boxes. The resulting PivotTable appears as shown in Figure 19.31.
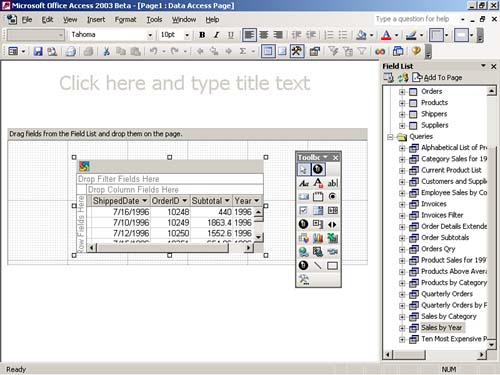
Switch to Form view and enter any necessary parameters. Drag and drop row and column headings to the Drop Filter Fields Here and Drop Column Fields Here drop zones, as desired. Use the filter drop-downs to apply desired filters. Save your work.
To add a PivotChart to a data access page, follow these steps:
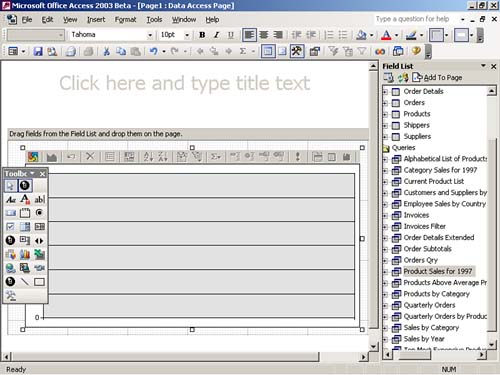
From the Database window, click Pages in the list of objects. Double-click the Create Data Access Page in Design View item. Activate the field list. Right-click and drag the appropriate query to the data access page. (This is an alternative to using the Layout Wizard.) Select PivotChart from the pop-up menu. Move and size the PivotChart as appropriate (see Figure 19.32).
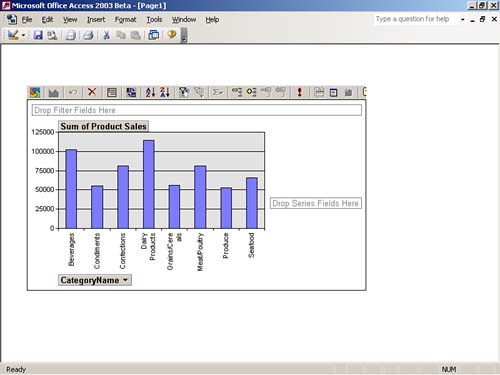
Drag and drop the appropriate fields to the Drop Series Fields Here and Drop Filter Fields Here regions of the data access page. Figure 19.33 shows a PivotChart that results after the CategoryName field is dropped from the Northwind database Category Sales for 1997 query on the Drop Filter Fields Here region and the ProductSales field is dropped on the Drop Series Fields Here region.
|