Hack 29. Create Conditional Subtotals
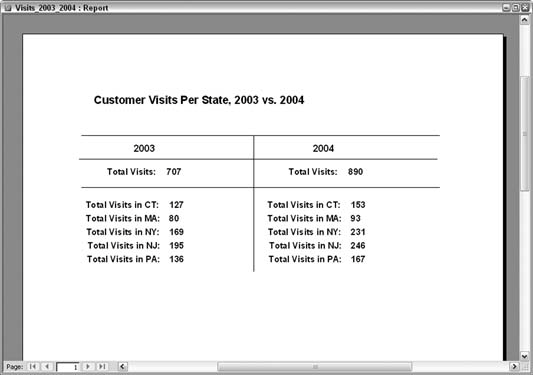
Split a grand total into pertinent business summaries using running sums and expressions. A common request is to create two sets of totals for comparison. This, by itself, is reasonable in a report design; you can set a group that is based on a field that breaks on different values. A perfect example is data based on a year. If the report includes a Year field, you can include subtotals in the group footer. That is, you can get a summary (of whatever other fields) for each year. But when you throw in the need to report totals on more than one condition, things start to get a bit messy. You can create two groups, but you must decide which group nests inside the other. That decision isn't always clear-cut. Added to this are various layout options. If you want to arrange these subtotals in any fashion other than underneath each other, you are out of luckthat is, unless you use running sums and calculated controls. Figure 4-8 shows a report that displays grand totals for each year and, underneath them, the yearly grand totals separated by each state's contribution. Figure 4-8. Grand totals and subtotals
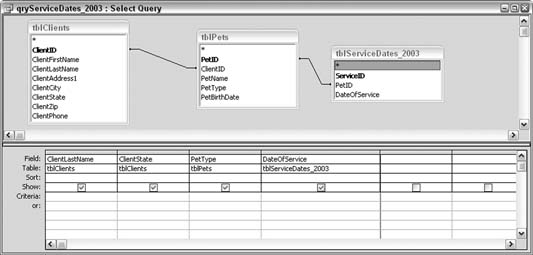
This hack uses an example of a veterinary practice, which has data about visits to the practice over two years and clients who come from five different states. The report's record source is based on a Union query that combines two identical Select queriesidentical, that is, except that one uses records for 2003 and the other uses records for 2004. The report's record source, therefore, is the following statement: SELECT * FROM qryServiceDates_2003 Union SELECT * FROM qryServiceDates_2004 Figure 4-9 shows the qryServiceDates_2003 query. Each customer has zero or more pets, and each pet has zero or more visits. Bear in mind that the report reports on visits only. The type of pet isn't relevant, but the data model calls for the pets table (tblPets) to be included. Figure 4-9. Querying information about visits
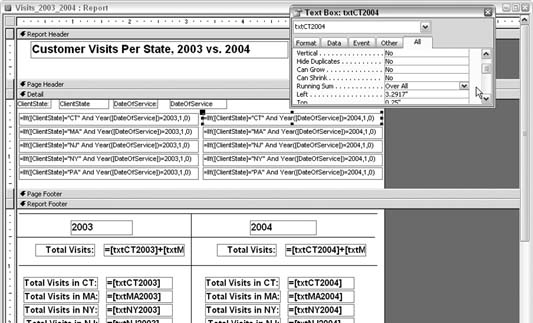
4.3.1. Using Running SumsThis report processes hundreds of records, but only the totals appear because the detail section's Visible property has been set to false. Even so, the details section plays a vital role in housing a set of text boxes that are used for running sums. Figure 4-10 shows the report design.create two sets of totals for comparison. This, by In addition to actual data fields, the detail section contains 10 unbound text boxes, all of which have the Running Sum property set to Over All, as shown in the property sheet in Figure 4-10. The 10 text boxes handle the 10 possible conditions. The data comprises two years and five states, for a total of 10 possible subtotals. Each unbound text box has a calculation for its control source. For example, the txtCT2004 text box contains this expression: =IIf([ClientState]="CT" And Year([DateOfService])=2004,1,0) This statement gets the running sum to increment only when the state is CT and the year is 2004. Each text box works in this way, with each incrementing on some variation of the two conditions, state and year. Figure 4-10. The Running Sum property set to Over All
The names of these text boxes are vital because they are referenced in other controls in the report footer. The names are txtCT2003, txtCT2004, txtMA2003, txtMA2004, and so on. All in all, five states are used: CT, MA, NY, NJ, and PA. The report footer contains two areas, one for the summary of each year. The areas are separated visually with some line controls. There is no real setting to split the report footer. All the text boxes in the report footer are unbound, and they reference the text boxes in the detail section. For example, the report footer text box that displays the total for CT for 2003 simply references the txtCT2003 running sum text box, with this statement: =[txtCT2003] The 10 summaries in the report footer that display a sum based on year and state all work in the same way. Each references a single text box from the detail section. The two grand totals in the footer, the ones based on total year, simply sum the associated five text boxes from the detail section. For example, the text box that displays the grand total for 2004 has this statement for its control source: =[txtCT2004]+[txtMA2004]+[txtNY2004]+[txtNJ2004]+[txtPA2004] By calculating totals in the detail section and then referencing those running sum text boxes, you can arrange the report's layout any way you wish. 4.3.2. Hacking the HackThe data model shown in this hack (see Figure 4-9) includes a table with pets. What if the user wanted to report by year, state, and pet? Assuming the data includes 10 types of pets (cat, dog, bird, and so on), you would have 100 variations of conditions: that is, 2 years times 5 states times 10 pet types. You could create such a report using the steps described in this hack, but this would be tedious. A better approach with such a large number of conditions is to base the report on a Crosstab query. The example in "Summarize Complex Data" [Hack #45] uses the data model from this hack to show how such a query works. 4.3.3. See Also
|