If you're just getting started with .NET, then you're in for a treat. There's a lot to love about the .NET development environment—both for debugging and for writing new code. Have you ever been frustrated that MFC and ATL were virtually impossible to use without a wizard? Have you ever banged your head on the wall for a week trying to track down a memory leak in your code, or thought the Windows API seemed… well… haphazardly thrown together with no rhyme or reason by a hundred different people who obviously didn't communicate with each other at all? .NET fixes all of this.
Have you ever been annoyed at having to deal with VARIANT and SAFEARRY types that look easy in Visual Basic but take so much work in other languages? If you're a VB programmer, have you ever yearned for multithreading, object inheritance, and access to C++ specific Windows API functions? In fact, why is there such a distinction between languages in the first place? Why can't we write a simple function in JScript to call legacy C++ and COBOL functions without having to write reams of "plumbing" code? .NET fixes all these things, too.
Before diving into the rest of the book, let's take a whirlwind tour of the following new features in .NET that are particularly useful for debugging:
No more memory problems
Language independence
Remote debugging and cross-machine debugging
Detachment from process
ASP.NET
The core of .NET is a virtual machine called the common language runtime (CLR). Rather than compiling code to native assembly language, .NET compilers produce an intermediate language called MSIL, which is Just-In-Time interpreted. Everybody's first question is whether this virtual machine will inflict a performance penalty. Yes, the current version of the .NET CLR will cost you some speed, and anybody who tells you otherwise is fibbing (except for ASP.NET web pages, which really are faster than traditional ASP). Fortunately, though, this performance penalty is negligible for most applications. Besides, you can't just focus on the performance loss without considering the extra benefits the CLR provides. The benefits are many, but the greatest two are type-safety and garbage collection.
JScript and VB programmers were largely isolated from the problems of memory management, but to C++ programmers, memory problems were legion. Have you ever miscounted on COM's AddRef() and Release() methods? Have you ever written off the bounds of an array? Have you ever accessed the methods of an object that had already been deleted? With .NET, developers are freed from the tedium of low-level memory management. Allocate your objects knowing they will automatically be deleted when they are no longer needed. And never fear memory smashes—writing off the bounds of an array is still an error, but at least the error will consistently appear as an exception at the moment the bug occurs, rather than as a Global Protection Fault much later on.
Best of all, most .NET languages support type-safety and garbage collection features without any effort on your part. You don't have to do any magic to make your objects automatically free themselves when they're no longer needed—the CLR automatically takes care of all those low-level details on its own. In extreme situations, you can use the unsafe keyword in C# to partially turn off this automatic memory management. But more likely, you'll find type-safety and garbage collection to be so helpful that you'll never want to live without them again.
.NET is highly language agnostic. It is true that Microsoft has chosen C# and VB .NET to be the two languages in which most Microsoft .NET code samples will be written, but any object-oriented language could be plugged in as part of the .NET Framework, and that language could access all the .NET library APIs just as effectively as any other. Unlike previous versions of Visual Studio, VS.NET uses a single Integrated Development Environment (IDE) for all languages: C++, VB, JScript, C#, HTML, etc. No longer do developers have to learn one set of commands for the Visual Basic IDE and another set for the Visual C++ IDE.
But even better, you can even use multiple languages simultaneously. One of .NET's most impressive demos involves writing a class in VB.NET, and then writing a C# object that inherits from that VB class, and overriding one of the methods. Then code is written in yet another language (for instance, C++) to instantiate the C# object and invoke its methods without any special plumbing code. You can write most of your application in one language, but if you'd like to use sample code written in another language, then no problem! Just drop that other code in and then the two languages can interact seamlessly.
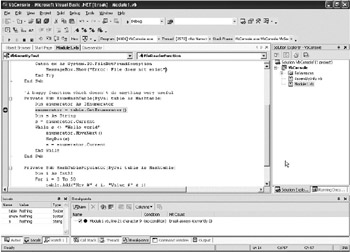
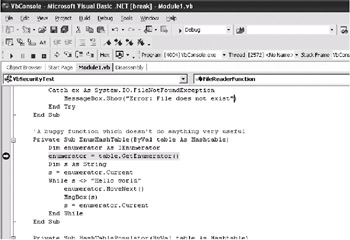
In fact, you can even debug across languages seamlessly, too. Set a breakpoint on the C++ code where you are about to invoke the C# object. Step into the C# method call just as you would for any regular function, and the debugger magically takes you to the right code exactly as if you'd been debugging C# all along (see Figure 1-1). If that method calls one of the VB.NET methods, then the debugger will take you there, too. Debugging cross-language programs was possible before .NET, but it was never easy. But now, cross-language debugging is simple enough to become routine.
Although few developers were aware of it, Microsoft Visual C++ 6.0 came equipped with a remote debugger. But there was a reason most people had never heard of it—just getting started with that remote debugger was such a pain. To use it, you first had to install special debugging system DLLs on the remote machine. But where would you get those DLLs? Were they on the Visual Studio CD somewhere? Most people never found them. After that, you had to run some complicated configuration details, too, but the biggest stumbling block was that first step.
With Visual Studio .NET, Microsoft has greatly improved the remote debugger. You still need to install those DLLs on the remote machine, but at least it's easy now. Stick the VS.NET CD in the drive and the first screen that comes up will ask whether you want to install the full Visual Studio .NET or just the remote debugging components (see Figure 1-2).
Once that's taken care of, the rest is manageable. You'll have to watch out for a few restrictions, but none of them are too difficult to understand. Where this feature really shines, though, is in cross-machine debugging. Assuming you have all the debugging symbols files installed in the correct places, then the VS.NET debugger allows you to step over the code on one machine, and then step into a function call on a remote machine. The debugger will "magically" step into that function in a way that looks as if the function call were local. As far as you can tell by the debugger, there's no difference between local and remote machines.
We'll talk more about the remote debugger in Chapter 6.
It's a handy trick to attach your debugger to a running process. If your program malfunctions on someone's computer, just attach your debugger and set breakpoints. But there was just one problem with this in Visual Studio 6. VS6 supported an attach debugger feature, but it had no detach feature. So you could connect to the process and debug, but once you were done, stopping the debugger would kill the process. No workaround existed for this problem.
Visual Studio .NET adds a great new feature—now the debugger can detach from a process as well as attach to it. The most common use for this is when debugging ASP.NET web pages. Maybe you merely want to observe the behavior of an ASP.NET web Service in the debugger but you don't want to change anything or stop the service. In that case, the new detach debugger feature is a godsend. It allows a whole new level of non-intrusive debugging.
With ASP.NET, Microsoft has rewritten their popular Active Server Pages to be better in virtually every way. Entire books could be (and have been) written about ASP.NET, but to quickly summarize, ASP.NET is one of the most compelling reasons to use .NET. Not only is it faster and more scalable than ASP, it requires less code, too. And upgrading to ASP.NET is a snap since you can migrate as much or as little of your web site as you want without having to modify the remaining ASP pages at all.
Unlike ASP, ASP.NET is debuggable with the same debugger used for regular VB or C# or C++ development. Did you ever use Microsoft's Script Debugger with ASP? Did you feel like you were being cheated? With ASP.NET, you can set breakpoints on your pages, or examine the value of a variable or step into and out of functions. Does your page make use of a .NET or COM component? No problem— the debugger can seamlessly step into that code, too. The ASP.NET debugger works exactly like the regular Visual Basic or C# debugger.
In fact, ASP.NET even comes with some other debugging goodies. For example, adding a single line to your page will turn on an impressive amount of automatic performance and diagnostic logging. Long story short: All the techniques you used to debug your ASP pages still work, but there are a lot of new ones you can use, too.