No matter how good of a coder you might consider yourself to be, you still need some structure during the process of building a system. If you want your new solution to be a success, you need to keep the quality high, and make sure it meets the needs of the users. If the designers, developers, and users do not speak the same language, you can be certain you will have problems in the end.
One of the worst things that can happen in a big project is when people think they mean the same thing, but really do not. Eventually this might lead to disagreement of which features to include in the solution, and thus make a perfectly functional system a failure. As consultants, we cannot afford to let this happen. If our customers are not happy with the result, we will have difficulties getting an assignment from them again. This is why it is so important to agree about the real requirements of the system. For such an agreement to occur in a project, you need to describe the system so that various groups of people involved will understand how it should function.
Take a simple example. Say your friend is building a house. In this process, he has carpenters, painters, plumbers, electricians, you name it, involved. If only one set of blueprints exists and only showed the exterior of the house, he would have serious problems. Why is this? Well, different workers need different views of what they are trying to build. The same thing is true when it comes to software engineering. To get consensus, you need a technique, and this technique is called modeling. Modeling has proven to be a success factor in many projects over the years.
The other day, we saw a TV show about a man in Sweden realizing his lifelong dream. He was building a real Batmobile, the car Batman drives around in. He and his friends were just in the process of finalizing this impressive vehicle. The team started by modeling an exact replica in Styrofoam. They actually modeled a full-scale Batmobile so they would have a good view of what to build. The model simplified the reality and made it easier to get everybody on the same page. Even though a model does not have to be this extreme, you are better off creating one (or more).
In the book The Unified Modeling Language User Guide by Grady Booch, James Rumbaugh, and Ivar Jacobson (Addison-Wesley, 1998. ISBN: 0-201-57168-4.), four aims are achieved with modeling:
Models help you visualize the system as it is or how you want it to be.
Models permit you to specify the structure or behavior of a system.
Models give you a template that guides you in constructing a system.
Models document the decisions you have made.
As you can see, you have much to gain by using this technique. And large, complex systems are not the only ones that benefit from modeling either. This helps even smaller systems, as many systems have a tendency to grow and become more and more complex. With a model, you can grasp this complexity, even after a long time has passed since the birth of the first version of the system. So if you do not model at the start of a project, you probably will regret it later on when it is too late. A good thing, proven over and over again in projects, is to have an object-oriented mind-set when designing and building software solutions.
You must also think about modeling at different levels. Sometimes you need a high-level view of the system, and sometimes you need a low-level view. You need, for example, one view when showing the solution to decision makers and another one when talking to developers.
Modeling can be difficult, however. If you are not careful when you choose what to model, you might be misled by your models and thus focus on the wrong things. Because models are a simplification of reality, it might be easy to hide important details. To avoid this, you need to make sure you connect your models to reality. If you have a weaker connection in one place, you must at least be aware of it.
Do not think that one model is enough, either. Going back to the example of your friend's house, recall that different workers need different views. This is true here, too.
By using the Unified Modeling Language, you can achieve all this. UML is a standard for writing software blueprints, and as the name implies, it is a language. UML can be used to visualize, specify, construct, and document the deliveries (or artifacts) of a software-intensive system. But remember that because it is only a language, it is just one part of the development cycle.
If you have little experience of UML, here comes our crash course just for you. It is by no means a complete coverage of UML, but it is important to have an understanding of these concepts, since we use them frequently in this book. If you feel you have sufficient knowledge in this area, you can move on to the next part of this chapter, "Object Role Modeling (ORM)."
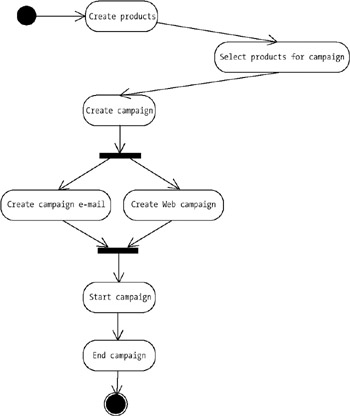
An activity diagram shows the flow of control. Activities are action states that move, or transition, to the next state after completion. In Figure 1-8, you can see activities as rounded rectangles. Our example shows a simple flow of control for the creation of sales campaigns mailed to registered customers, which are also published on a Web site. All transitions between the activities are represented by an arrow. To show activities performed in parallel, we use synchronization bars.
These diagrams are really flowcharts used early in the design process to show the workflow between use cases. You are not destined to use them at this point in the process, however. You can use them where you feel they are appropriate, or where you think they explain a flow in a system so that a decision maker can understand what you mean.
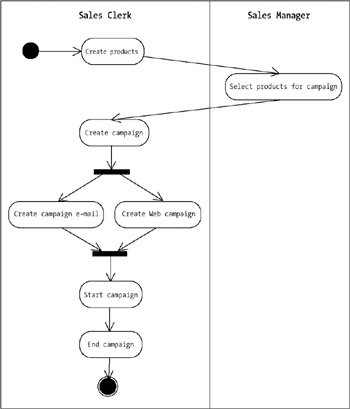
In your activity diagrams, you can use something called swim lanes to show ownership. In Figure 1-9, we have added a swim lane to our activity diagram to show the responsibilities of sales clerks and sales managers.
The clerk handles everything but the selection of what products to include in a campaign. That task is left to the sales manager. So now we have shown the responsibilities of all parties in this extremely simple scenario.
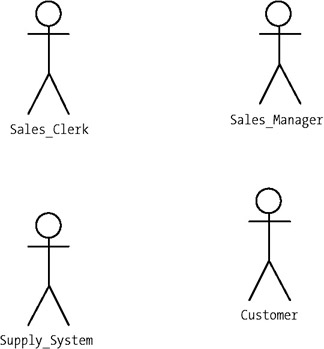
When you create use cases, you first have to decide which actors participate in your solution. An actor can be a person (or group of persons), but it can also be another system—that is, something that interacts with the system, but is outside the system. We represent our actors with stick figures, pretty much like the ones in The Blair Witch Project, if you are familiar with that movie (see Figure 1-10).
Let us continue our simple scenario from earlier. We have already mentioned two actors: the sales clerk and the sales manager. Do we have anyone else? One actor that immediately comes to mind is the customer. Another one might be a supply system, that is, a system that keeps track of our products and the information related to them (like stock, price, and description).
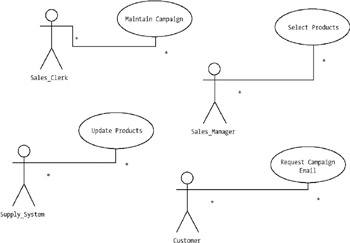
The next thing to do is find your use cases. You do this the easiest way, by looking at your actors and asking why they want to use the system. A use case in itself is a description of actions that a system performs to give an actor result of value. In our example, they are portrayed as ovals, as you can see in Figure 1-11.
In our example, the customer selects a campaign e-mail. The sales clerk maintains the campaign catalogs, and the sales manager requests available products. Finally, the supply system maintains the products.
Now when you have identified some use cases, you can start documenting them. This is done by describing the flow of events from the actors' point of view. You must also specify what the system must provide to the actors when the use case is executed. The use case should show the normal flow of events, but it should also show the abnormal flow—that is, when something goes wrong during execution and an alternate scenario takes place. (The scenarios will be on a high level, so you cannot catch all possible actions.)
Often, use cases will be great for showing the people paying for the system what actually will happen in it. This way, you can be assured early in the process that what you are building is what the customer expects.
Let us take a look at the sales clerk use case for a little while. This starts when the clerk logs in to the system. The system verifies the password and then shows the campaign maintenance form. The clerk can choose from various alternatives what he or she intends to do:
Modify campaign: Modify campaign subflow executes.
Delete campaign: Delete campaign subflow executes.
Review campaign: Review campaign subflow executes.
Exit: Use case ends.
When you have created your use case diagrams, you have a good overview of the system. If you are modeling an integration project, you must not forget to consider where you need to deal with legacy systems at this early stage. If you model your use cases thoroughly from the beginning, you will not be surprised by unexpected problems later on, when coding has started.
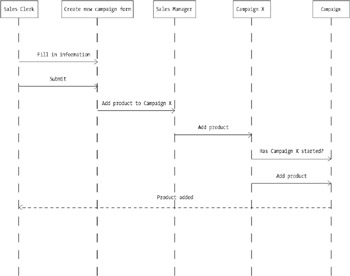
Sequence diagrams are used to illustrate the dynamic view of a system. They show the interaction and the messages sent between objects in chronological order (see Figure 1-12).
First, you place the objects that participate in the interaction at the top of the diagram across the x-axis. The object that initiates the interaction is typically placed to the left, and the more subordinate objects to the right. The messages sent are placed to the left along the y-axis (time). Our example here shows the addition of a new product to a campaign.
First the clerk fills in information about the product to be added to Campaign X. He or she then submits the information to the sales manager to see if the product is valid for this campaign. If the product is approved for addition, the manager tells the campaign object to add the product. The campaign object then checks that the campaign has not started, and if it has not, the product is added.
Sequence diagrams are great for showing what is going on. In collaboration with the customer, they can help in mapping out the requirements of the system. We suggest you do a sequence diagram for every basic flow of every use case, and keep doing them until you think you have enough. This is basically when you cannot find any more objects and messages. For instance, in our example, we do not have to do another sequence diagram to show how a sales clerk adds a product to Campaign Z. We already have a basic sequence diagram for this flow of events.
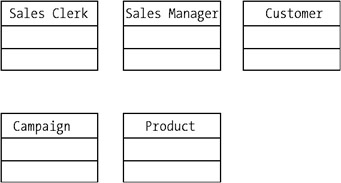
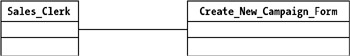
This is one of the most common diagrams used. Through class diagrams you can model the static design view of a system. A class diagram shows classes that are collections of objects with a common structure, behavior, relationships, and semantics. In UML, classes are represented by a rectangle with three compartments, as Figure 1-13 shows. The top compartment displays the name of the class, the middle one lists its attributes, and the bottom one indicates its behavior (or operations).
You can choose to show one, two, or all three of these compartments. When you choose the names for your classes, try to maintain a standard throughout your project. You can, for instance, decide to use singular nouns, like Customer, with a capital letter at the beginning. How you choose, or what you choose, is not important. What is important is that you stick to your standard, so as to avoid confusion later on.
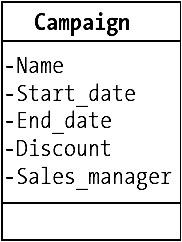
What UML modeling elements do you find in class diagrams? You will probably have many class diagrams in your model, since they show the logical view of your system. They show which classes exist, and the relationships between them. They also show associations, aggregations, dependencies, and inheritance. From your class diagram, you can see the structure and behavior of your classes. You can also see multiplicity and navigation indicators. Figure 1-14 shows the class Campaign and its attributes. In the real world, we would find out these attributes by talking to our customer and looking at our requirements. For the purposes of our example, let us say that the class has five attributes: Name, Start_date, End_date, Discount, and Sales_manager.
Name is the name of the campaign. Start_date and End_date represent the start and the end of the campaign. Discount is the percentage that prices belonging to this campaign are lowered during the campaign. Sales_manager is the name of the sales manager responsible for the campaign.
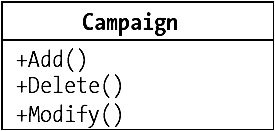
Next, you need to find some operations of your class. Operations are the behavior of the class. In Figure 1-15, we have hidden the attributes of the Campaign class and show only the class name and operations. Since this is a simplified view of a class, only three are specified: Add, Delete, and Modify. There could, of course, be many more, just as there could be many more attributes. It all depends on our requirements and the input from the customer.
When you have your classes, you can start looking for the relationships between them. Three kinds of relationships exist in UML according to the document "Introduction to the Unified Modeling Language" by Terry Quatrini (http://www.rational.com/uml/resources/whitepapers/index.jsp): association, aggregation, and dependency. They all represent a communication path between objects. One could argue that inheritance should be counted as a relationship; however, we chose to cover it separately a little later.
Association is represented by a line connecting classes, as you can see in Figure 1-16. This is a bidirectional connection, which means that one class can send a message to the other, because if they are associated, they both know the other is there.
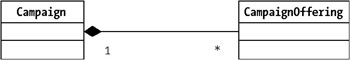
A stronger form of relationship is the aggregation. In UML, you show this as a line connecting the related classes. On one end the line has a diamond (see Figure 1-17). An aggregation shows the relationship between a whole (the diamond) and its parts. When you, as a developer, see this kind of relationship, you know this means there is a strong coupling between those object classes.
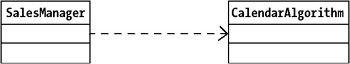
Figure 1-18 shows the third kind of relationship, the dependency. As you can see in this figure, the dependency is represented by a dashed line. It points from a client to a supplier. The client does not have to have semantic knowledge of the supplier, and so this is a weaker form of relationship. It shows that a change in the specification of one class may affect another class that uses it. Keep in mind that the reverse may not necessarily be true. Use dependencies when you want to show that one class uses another class.
To find your relationships, you start by looking at your sequence diagrams. If you find that two objects need to talk to each other, they must have a way of doing this. This way is the relationship. The deeper you analyze your diagrams, the more you will know what type of relationship to use. A parent-child relationship will probably be an aggregation, and so on.
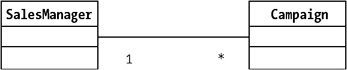
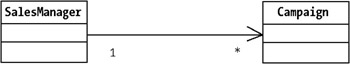
We will now spend a few moments on multiplicity and navigation. Multiplicity simply states how many objects participate in a relationship. It shows how many instances of one class relate to one instance of the other class. Based on this, you need to decide for each end of an association and aggregation what multiplicity is needed. Since multiplicity defines the number of instances, you represent it in your diagram with either a number or an asterisk (*). The asterisk is used to represent a multiplicity of many (see Figure 1-19). In our previous example, we could say that one campaign can only be owned by one sales manager. But one sales manager can own several campaigns. This is known as a one-to-many relationship, which would be represented as 1 − *.
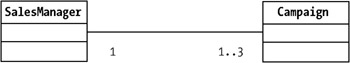
You decide multiplicity by examining your business rules. For our example, we could have a business rule stating that one sales manager can own only three campaigns. Then we would have a one-to-three relationship, as Figure 1-20 shows.
Navigation is represented by an arrow. You should try to start the arrow at the class that initiates communication between classes. The sales manager in our case initiates the communication with the campaign, which is why the arrow shown in Figure 1-21 starts at the SalesManager class.
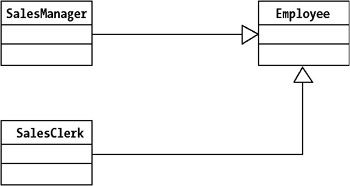
Inheritance is the relationship between a superclass and a subclass. In our example, if we have a class called Employee, we can have other classes like SalesManager or SalesClerk that are separate classes but still fall under the Employee class. That is, a SalesManager is an Employee. In Figure 1-22, you can see this relationship is shown with a triangle.
Be cautious when using inheritance. You do not want to build too many levels, because if you do, a change in one class will affect many others. This could bring disaster to your products, since you might have to make changes in many places because of this. Build another level only when you are sure there is an inheritance situation, and do not include it just for the sake of having it.
This is all the UML we will cover in this chapter. With the knowledge of the topics you have gleaned in this section, you have come quite some way down the path of designing a great system. A good source of information about UML, and the topics we did not cover here, is the book we mentioned earlier, The Unified Modeling Language User Guide by Booch et al.
After this quick UML course, you are equipped to understand the use cases shown in this book. In Chapter 9, we will use these diagrams to exemplify what we mean and how we reason when building our examples.