Creating a Report Using a Wizard

One of the features you can use to create a simple report in Access is the AutoReport Wizard, which arranges data in a selected table or query as a formatted report. The AutoReport: Columnar Wizard displays each record's data vertically, while the AutoReport: Tabular Wizard displays the data for each record horizontally. You can also create a report using the Report Wizard, which allows you to select the fields and information you want presented and to choose from available formatting options that determine how the report will look.
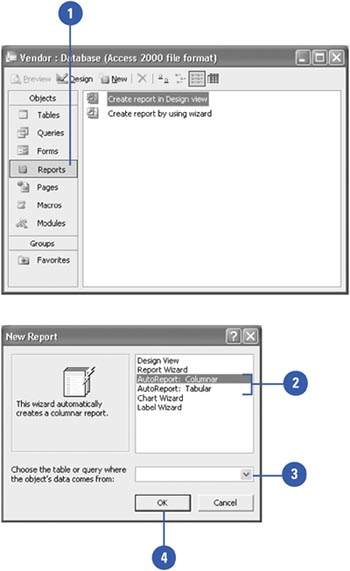
Create and Save a Report Using the AutoReport Wizard
 | In the Database window, click Reports on the Objects bar, and then click New. |
 | Click AutoReport: Columnar (to display records in a column), or click AutoReport: Tabular (to display records in rows). |
 | Click the list arrow, and then click a table or query on which to base the report. |
 Click OK. Click OK.
Access displays the form in Print Preview, but you can switch to Design view, save, print, or close the report.  | Click the Save button, type a name for your report, and then click OK. |
|
You can create an instant report with the AutoReport command.
In the Database window, select the table or query that contains the data you want formatted as a report. Click the Insert menu, and then click AutoReport. After a moment, Access generates a simple columnar report without headers or footers. |
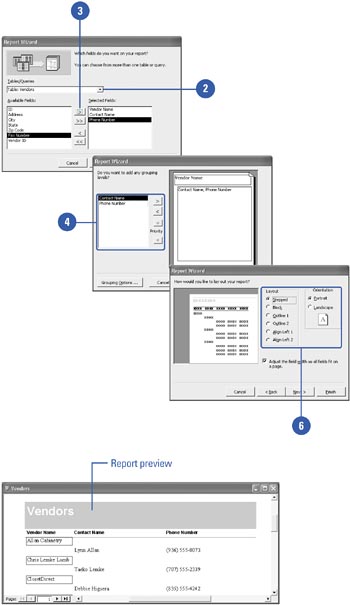
Create and Save a Report Using the Report Wizard
| In the Database window, click Reports on the Objects bar, and then double-click the Create Report By Using Wizard icon. |
| Click the list arrow for choosing a table or query on which to base the form, and then click the name of the table or query you want. |
| Select the fields you want to include, indicating the source of any fields you want to include from other tables or queries. Click Next to continue. |
| If necessary, specify any groupings of the records, choosing any or all of the selected fields (up to ten). Click Next to continue. |
| Specify the order of records within each group, sorting by up to four fields at a time, and then specify ascending or descending order. Click Next to continue. |
 | Determine the layout and orientation of your report. Click Next to continue. |
 | Specify the style of the report, which affects its formatting and final appearance. Click Next to continue. |
 | In the final wizard dialog box, name your report, and then indicate whether you want to preview the report or display it in Design view. Click Finish. |
|