Modifying the Appearance of a Datasheet
You can customize how data in a datasheet appears to make the data easier to work with. Changes made to the appearance of the Datasheet view affect only the display of the data, not the underlying structure of the table.
Changing the Appearance of Text
One of the things that you can change about a datasheet is the appearance of its text. Here's the process:
Choose Format | Font. The Font dialog box appears (see Figure 2.10).
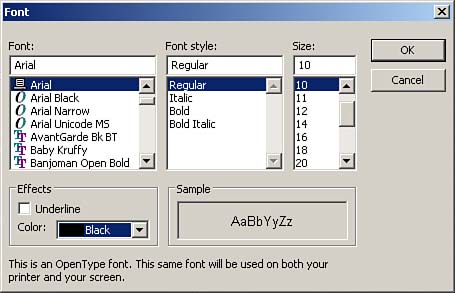
Select the desired font, color, font size, and so on. Click OK when you're finished. Access applies the selections to the entire datasheet.
Changing Column Widths
In addition to customizing the datasheet font, you can modify the width of the columns within a datasheet. This is how you do it:
Move the mouse within the right column separator in the column heading until you get a double-headed arrow. Drag to the right or left to increase or decrease the size of the column. Release the mouse when the column reaches the desired size.
Changing Row Height
Whereas the process of changing a column width changes the width of the selected column(s), the process of changing the row height affects all rows in the table. To change the row height, follow these steps:
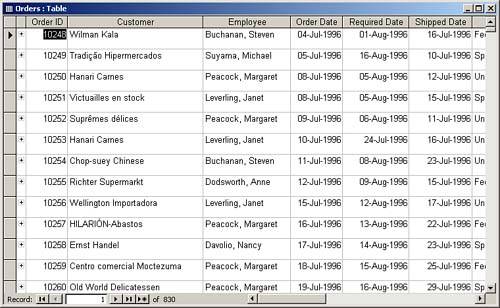
Place the mouse pointer at the lower row border in the record selector area until the mouse pointer turns into a double-headed arrow. Drag up or down to increase or decrease the height of the row. Release the mouse when the row reaches the desired height. Notice that in Figure 2.11 the row height has been increased.
Freezing Columns
There are times when you want to ensure that specific columns remain visible, even when you scroll to view other columns in the table. For example, you might want the CustomerID and CompanyName columns to remain visible, even when you scroll to the right to view other fields. Freezing table columns solves this problem. Here's how it works:
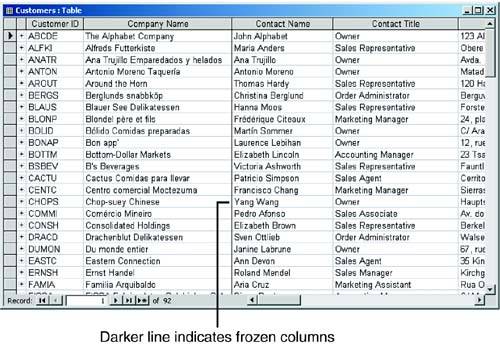
Click the column selectors of the columns you want to freeze to select the desired columns. Choose Format | Freeze Columns. Notice that a dark line appears between those columns and the other columns (see Figure 2.12).
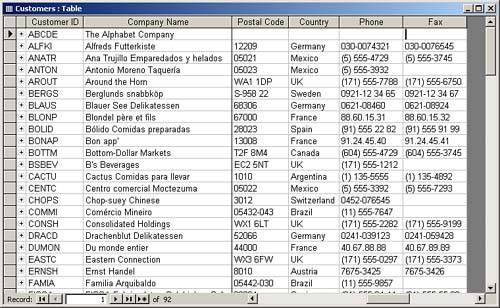
Using the scrollbar at the bottom of the page, scroll to the right. Notice that the frozen columns remain onscreen as you view columns to the right (see Figure 2.13).
 | There are some tips and tricks that you should know in working with columns (not just frozen columns). You can double-click the column field name border to autofit the column size. To unfreeze columns, you can choose Format | Unfreeze All Columns. Finally, to select more than one column, you can click the field selector for the first column and drag to select contiguous columns. |
Modifying the Appearance of a Datasheet
So far in this hour, you've learned how to modify the appearance of the text within a datasheet, but you have not learned how to modify the appearance of the datasheet itself. Here's the process:
Choose Format | Datasheet. The Datasheet Formatting dialog box appears (see Figure 2.14).
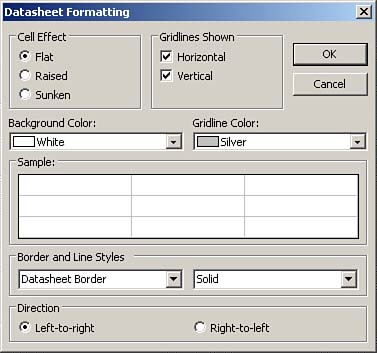
Select the desired option from the Cell Effect group box: Flat, Raised, or Sunken. Indicate whether you want to include horizontal and/or vertical gridlines. Designate the background color and gridline color for the grid. Specify the border as Datasheet Border, Horizontal Gridline, Vertical Gridline, or Column Header Underline. Specify the line style as Transparent Border, Solid, Dashes, Short Dashes, Dots, Sparse Dots, Dash-Dot, Dash-Dot-Dot, or Double Solid. Indicate whether the text should appear from left-to-right or right-to-left within the grid. Click OK to close the dialog box and apply the changes.
Hiding and Unhiding Columns
Sometimes it is not necessary to view certain columns in a datasheet. Fortunately, you can hide and unhide columns as necessary.
To hide columns, follow these steps:
Select the column(s) to be hidden. Choose Format | Hide Columns. The selected columns disappear.
Although you might not need to see the data in a column for some time, you might need to see it at a later time. To unhide columns, follow these steps:
Choose Format | Unhide Columns. The Unhide Columns dialog box appears (see Figure 2.15).
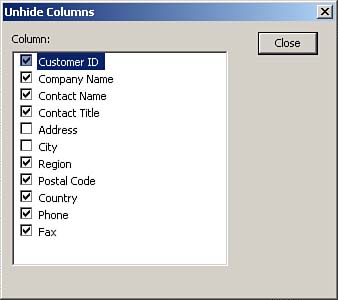
Click to select the columns you want to redisplay. Click Close to close the dialog box and apply the changes.
Expanding to Show the Subdatasheet Data
There may be times when you want to show all the subdatasheet data for all the records in a datasheet. Fortunately, you do not need to click to expand the datasheet for each row individually! You simply choose Format | Subdatasheet | Expand All. All subdatasheets appears (see Figure 2.16). To collapse them again, you select Format | Subdatasheet | Collapse All.

 |