Building a Report by Using a Wizard
The final wizard that we're going to take a look at in this hour is the Report Wizard. No matter how experienced you are as an Access user or developer, the Report Wizard can save you much time and effort. For instance, the Report Wizard can lay out controls and create summary calculations much more quickly than I can in Design view.
To create a report with the Report Wizard, follow these steps:
Click Reports in the Objects list and then double-click the Create Report by Using a Wizard icon. This launches the Report Wizard.
 | Another way to start the Report Wizard is to select Tables or Queries from the Objects list in the Database container and then click the table or query that you want the report to be based on. From the New Object drop-down list box on the toolbar, you select Report. In the New Report dialog box, you select Report Wizard. You don't have to use the Tables/Queries drop-down list box to select a table or query because the one you selected before invoking the wizard is automatically selected for you. |
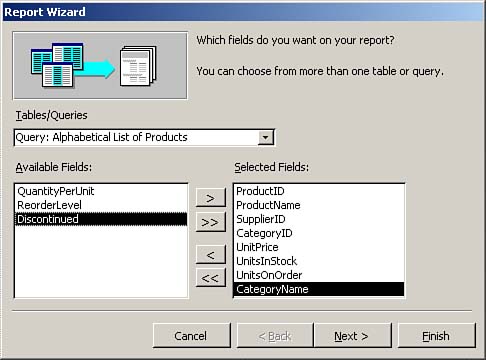
In the first step of the wizard, you select the table or query that will supply data to the report. I prefer to base reports on queries or on embedded SQL statements. This generally improves performance because it returns the smallest dataset possible. Basing reports on queries also enhances your ability to produce reports based on varying criteria. After you select a table or query, you can select the fields you want to include on the report. Access displays the fields included in the selected table or query in the Available Fields list box. To add fields to the report, double-click the name of the field you want to add or click the field name and then click the right-arrow button. In the example in Figure 6.20, several fields from the Alphabetical List of Products query in the Northwind database are selected. When you are done selecting a table or query and the fields you want to include on the report, click Next.
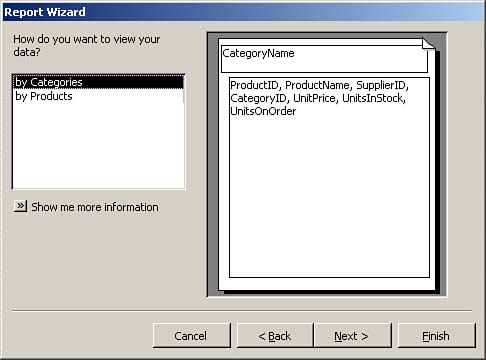
If you based your report on data from more than one table or on a query that retrieves data from multiple tables, the Report Wizard shows a dialog box that lets you determine how to view the data. For example, in Figure 6.21, the Report Wizard prompts you to select whether to view the data by category or by product. If this dialog box appears, make a selection and click Next.
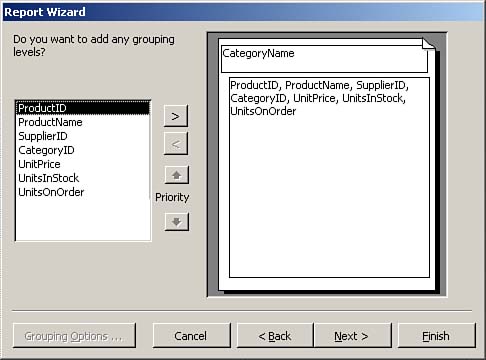
Access prompts you to add group levels (see Figure 6.22), which add report groupings, to the report. Add group levels if you need to visually separate groups of data or include summary calculations (subtotals) in a report. Notice that in Figure 6.22 the CategoryName grouping appears. This is because I opted to view the data by category in the previous step of the wizard. If a report doesn't require additional groupings, click Next.
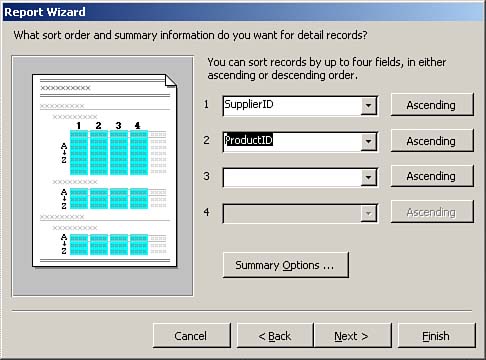
In the next step of the Report Wizard, you choose sorting levels for the report. Because the order of a query underlying a report is overridden by any sort order designated in the report, it's a good idea to designate a sort order for the report. You can add up to four sorting levels by using the Report Wizard. In the example shown in Figure 6.23, the report is sorted by the SupplierID and then the ProductID fields. Notice the Ascending buttons to the right of the drop-down list boxes. If you click the buttons, they toggle to read Descending, causing the data to sort in descending order. After you select the fields you want to sort on, click Next.
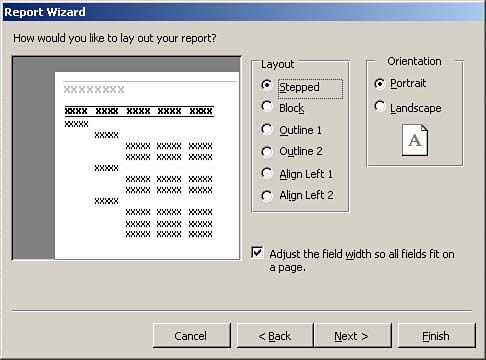
In the next step of the Report Wizard, you decide on the report's layout and orientation (see Figure 6.24). The layout options vary depending on what selections you have made in the wizard's previous steps. The orientation can be Portrait or Landscape. This step of the Report Wizard also allows you to specify whether you want Access to adjust the width of each field so that all the fields fit on each page. Supply Access with this information and then click Next.
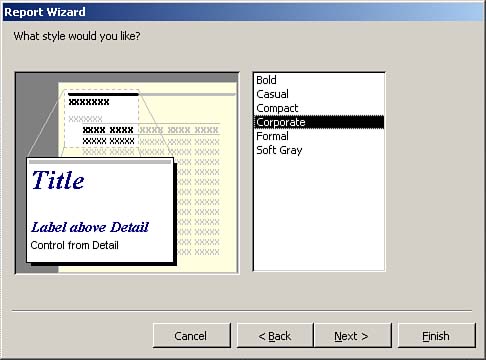
In the Report Wizard's next step, you choose a style for the report (see Figure 6.25). The choices are Bold, Casual, Compact, Corporate, Formal, and Soft Gray. You can preview each look before you make a decision by simply clicking the style. Later on, you can modify any of the style attributes that the Report Wizard applies, as well as other report attributes that the wizard defines. You accomplish this in Design view any time after the wizard produces the report. After you select a style, click Next.
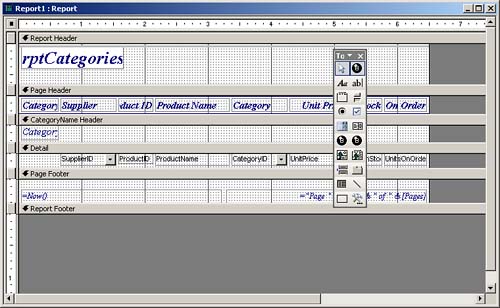
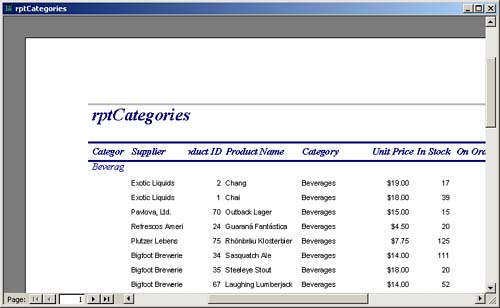
The final step of the Report Wizard prompts you for the report's title. Access uses this title as both the name and the caption for the report. (You can supply a standard Access report name and modify the caption after the Report Wizard has finished its process.) You're then given the opportunity to preview the report or modify the report's design. If you opt to modify the report's design, Access places you in Design view rather than in Print Preview view (see Figure 6.26). You can then preview the report at any time (see Figure 6.27). You can optionally mark the check box Display Help on Working with the Report to have Access display the Help window and list the associated report topics.
|