| [ Team LiB ] |
|
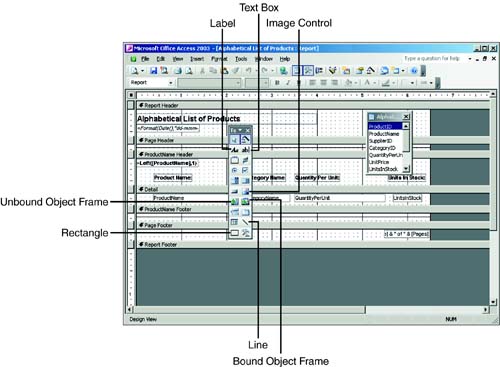
Selecting the Correct Control for the JobReports usually contain labels, text boxes, lines, rectangles, image controls, and bound and unbound object frames (see Figure 12.8). The other types of controls (such as combo boxes and list boxes) are generally used for reports that emulate data-entry forms. The different controls that you can place on a report, as well as their uses, are discussed briefly in the following sections. Figure 12.8. Controls you can add to reports.
LabelsYou use labels to display information to users. Labels are commonly used as report headings, column headings, or group headings for a report. Although you can modify the text labels display at runtime by using Visual Basic for Applications (VBA) code, you cannot bind them directly to data. To add a label to a report, you select the Label tool in the toolbox and then click and drag to place the label on the report. Text BoxesYou use text boxes to display field information or the result of an expression. You can use them throughout a report's different sections. For example, in a page header, a text box might contain an expression showing the date range that's the criteria for the report. In a group header, a text box might be used to display a heading for the group. The possibilities are endless because a text box can hold any valid expression. To add a text box to a report, you select the Text Box tool from the toolbox and then you click and drag the text box to place it on the report. You can also add a text box to a report by dragging a field from the field list to a report. This works as long as the field's Display Control property is a text box. LinesYou can use lines to visually separate objects on a report. For example, you can place a line at the bottom of a section or under a subtotal. To add a line to a report, you click the Line tool in the toolbox to select it and then you click and drag to place the line on the report. When a line is added, it has several properties that you can modify to customize its look.
RectanglesYou can use rectangles to visually group items that logically belong together on a report. You can also use them to make certain controls on a report stand out. For example, you can draw rectangles around important subtotal or grand total information that you want to make sure the report's readers notice. To add a rectangle to a report, you select the Rectangle tool from the toolbox and then click and drag to place the rectangle on the report. Bound Object Frames
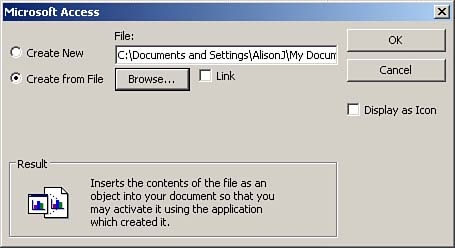
To add a bound object frame to a report, you click the Bound Object Frame tool in the toolbox and then click and drag the frame onto the report. You need to then set the Control Source property of the frame to the appropriate field. You can also add a bound object frame to a report by dragging and dropping an OLE field from the field list onto the report. Unbound Object FramesYou can use unbound object frames to add logos and other pictures to a report. Unlike bound object frames, however, unbound object frames aren't tied to underlying data. To add an unbound object frame to a report, you click the Unbound Object Frame tool in the toolbox and then click and drag the object frame to place it on the report. An insert object dialog box, shown in Figure 12.9, appears, and you use this dialog box to create a new OLE object or to insert an existing OLE object from a file on disk. If you select the Create from File option, the insert object dialog box changes to look like Figure 12.10. You can click Browse to locate the file you want to include in the report. The insert object dialog box gives you the option of linking to or embedding an OLE object. If you select Link, a reference is created to the OLE object. Access stores only the bitmap of the object in the report, and the report continues to refer to the original file on disk. If you don't select Link, Access copies the object you select and embeds it in the report so that it becomes part of the Access .MDB file; no link to the original object is maintained. Figure 12.9. The insert object dialog box, where you insert a new or existing object into an unbound object frame.
Figure 12.10. The insert object dialog box with Create from File selected.
Image ControlsImage controls are the best option for displaying static images, such as logos, on a report. An unbound object can be modified after it is placed on a report, but you can't open the object application and modify an image when it's placed on a report. This limitation, however, means far fewer resources are needed with the Image control, so performance improves noticeably. Figure 12.11 shows a report with an image control. Figure 12.11. A report with an image control.
Other ControlsAs mentioned earlier in this chapter, it's standard to include mostly labels and text boxes on reports, but you can add other controls, such as combo boxes, when appropriate. To add any other type of control, you click to select the control in the toolbox and then click and drag to place it on the report. |
| [ Team LiB ] |
|