Hack 45. Summarize Complex Data
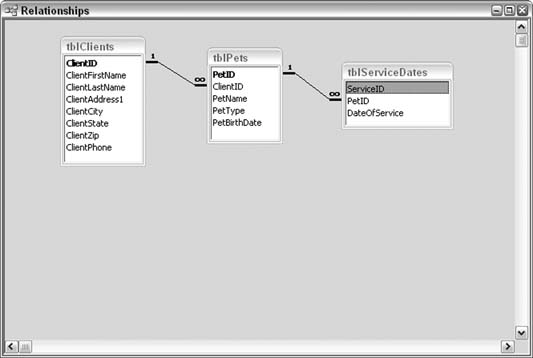
Take advantage of Crosstab queries to get a view on multifaceted data. When you need to aggregate data that has more than a simple grouping structure, Crosstabs are the way to go. "Create Conditional Subtotals" [Hack #29] shows you how to use groups and conditional summing on a report. That works as long as the conditions don't lead to an overwhelming number of possibilities. The example in that hack uses five states and two years on which to create subtotals. The data model, though, has another table in play: a table of pets (the model is a simulation of a veterinary practice). This creates a large number of possibilities, such as all cat visits in New York in 2003, or all dog visits in Pennsylvania in 2004, and so on. Figure 5-21 shows the updated data model for this hack. Figure 5-21. The pets data model
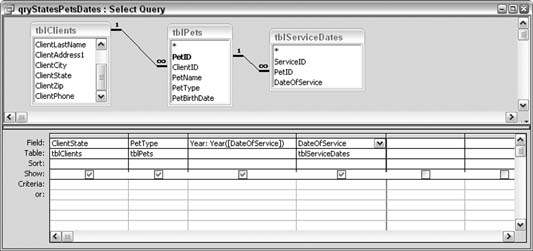
The data model includes seven types of pets (bird, cat, dog, ferret, horse, monkey, and snake), five states (CT, MA, NJ, NY, and PA), and two years of data (2003 and 2004). This makes 70 possible combinations. The best way to sum up the number of visits in which all these combinations of criteria are mixed and matched is to use a Crosstab query. To get started, we must put together a Select query to join the different tables and return the fields needed in the Crosstab. Note that the Select query has a calculated field that isolates the year out of the DateOfService field. Figure 5-22 shows the design of the Select query. Figure 5-22. A Select query on which a Crosstab will run
5.7.1. Introducing the CrosstabAccess has a Crosstab Query Wizard, which walks you through creating a Crosstab query. Figure 5-23 shows the New Query dialog box in which a Crosstab query is initiated. Figure 5-23. Starting up the Crosstab Query Wizard
In this example, select the qryStatesPetsDates query in the first screen of the wizard, as shown in Figure 5-24. In the next screen, select two fields as the rows. In a Crosstab query, the rows act as groups. Note that at least two fields must remain after you select fields for the rows. Select the state and pet type fields to be the row headings. Figure 5-24. Selecting the Select query
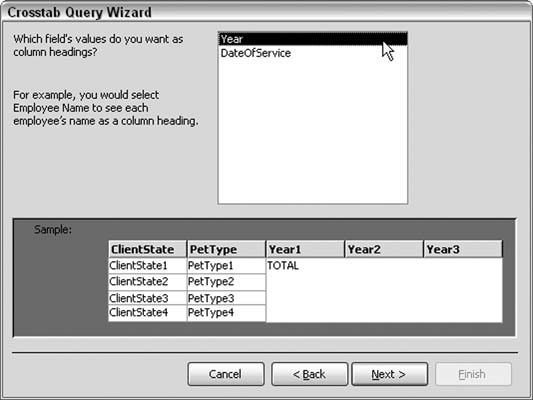
In the next screen, select a field to be the column field. Crosstabs require at least one column field. Choose Year here, as shown in Figure 5-25 (note that this figure shows the third screen, not the second). Figure 5-25. Selecting Year as the column heading
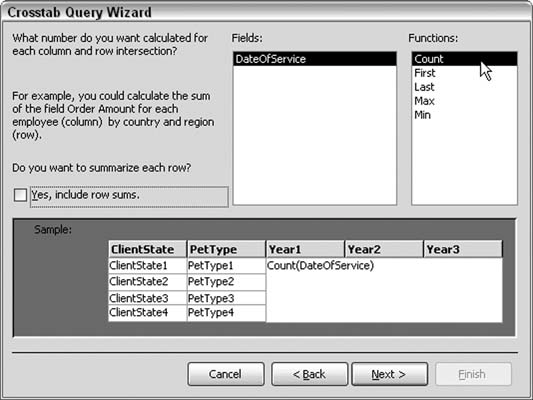
In the last field selection screen, one field remains. Select the type of aggregationin this case, Count, as shown in Figure 5-26, because the purpose is to count visits. Also be sure to uncheck the "Yes, include row sums" checkbox on the left. Keeping this checked returns a field of sums based on just combinations of state and pet type (the row headings) and that isn't our focus here; we're looking for the combination of state, pet type, and year. Figure 5-26. Selecting to return a count
When the query completes, all the counts are available. Figure 5-27 shows how the query presents sums in all combinations of state, pet type, and year. Figure 5-27. The completed Crosstab query
There are 35 records by virtue of the fact that state and pet type are row headings, and year is a column heading. This still provides the 70 unique combinations because the two years, 2003 and 2004, each have their own column. 5.7.2. See Also
|