


Breakpoints work in Enterprise Architect much like in any other debugger. Setting a breakpoint notifies the debugger to trap code execution at the point you have specified. When a breakpoint is encountered by a thread of the application being debugged, the source code is displayed in an editor window, and the line of code where the breakpoint occurred is highlighted.
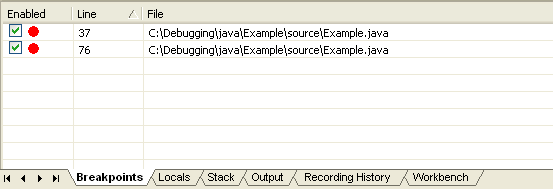
An Enterprise Architect model maintains breakpoints for every package having a Build Script - Debug Command. Breakpoints are displayed in a tab of the Debugger Workbench window (press [Alt]+[8]). Selecting a different package in the tree updates the breakpoints displayed, depending on whether the node selected, or its parent, has a script attached.
Note: The debugger does not stop automatically. It runs to completion unless it encounters a breakpoint.
Breakpoints are maintained in a file according to the format:
path\prefix_username.brkpt
where
| · | path = The default working directory specified in your Build Script |
| · | prefix = Tree View Node Name / Package name |
| · | username = Host system username of Enterprise Architect user |
Breakpoint States
DEBUGGER STATE |
||
|
Running |
Not running |
|
Active breakpoint |
Enabled breakpoint |
|
Unbound breakpoint |
N/a |
|
Failed breakpoint |
N/a |
|
Disabled breakpoint |
Disabled breakpoint |
See Also