


The debugger enables you to record your debug session and create Sequence diagrams from the Stack Trace History. Recording can only occur for a given thread. The Debug Toolbar record buttons (Record and Autorecord) become enabled whenever a thread is available for recording. This occurs when a thread encounters a breakpoint, and becomes suspended.
For .Net applications, the first thread to begin execution automatically stops at the first method entered that is recognized as being part of the current Enterprise Architect model.
For most applications it is typical that you would set breakpoints at positions in the code to trace.
You can begin recording in either of the following ways:
| · | Manual recording |
| · | Automatic recording. |
Manual Recording For A Thread
Either:
| · | Click on the Record button, or |
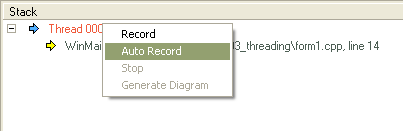
| · | Right-click on the Stack tab to display the context menu, and select the Record option. |
Thereafter you must issue debug commands {StepIn, StepOver, StepOut, Stop} manually. Each time you issue a step command and the thread stack changes, the sequence of execution is logged. When you have finished tracing, click on the Stop button.
Click on the Create Sequence Diagram button to generate the diagram.
Automatic Recording For A Thread
Either:
| · | Click on the Autorecord button, or |
| · | Select the Stack tab, right-click to display the shortcut menu, and choose the Auto Record option. |
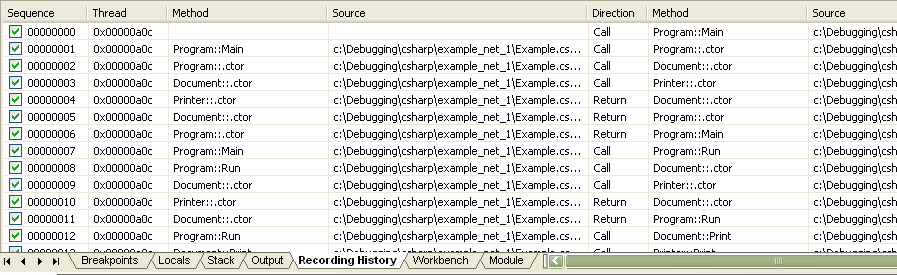
The Stack Trace History, Stack tab and Source Code Editor dynamically update to reflect the current execution sequence for the thread.
Note: No other threads are recorded, with the exception of entries for thread creation and termination.
Stack Trace Recording ends when the thread ends, or when you click on the Stop button.
Click on the Generate Sequence Diagram button.
The following example shows a debug sequence recorded for a thread executing managed C++ code under Microsoft .Net 1.1.
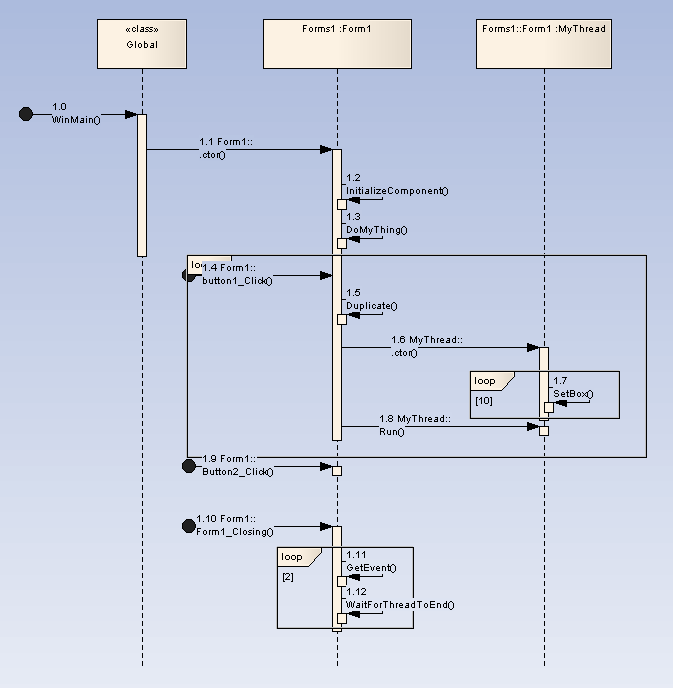
Creating the Sequence Diagram
Once you have built up a stack trace history, you are then able to create a Sequence diagram from your results. To do this, click on the Create Sequence Diagram button on the toolbar and give your diagram a name. Your diagram is placed under the package that is running your debug session.
Commands
|
Record Stack Trace for Thread |
|
Auto Record Stack Trace For Thread |
|
Stop Recording |
|
Create Sequence Diagram |
|
Save recorded history to HTML file for viewing in browser |