


The debugging components of Enterprise Architect comprise the Debug Toolbar and a tabbed Debug Workbench. To display these, either press [Alt]+[8] or select the View | Debug Workbench menu option.
If a Debug script has been configured for the currently selected package, the Run button is enabled. If no script has been created or is incomplete, all buttons are disabled and debugging remains unavailable.
As Build Scripts are linked to a package, selecting a package in the Project Browser window also changes the active Build Script and, naturally, the target to be debugged.
Breakpoints are recorded against the package also, and these update depending on which package is selected.
Starting The Debugger
To start debugging click on the Run button on the toolbar or press [F6].
Note: the debugger only stops if it encounters breakpoints, so these should be set beforehand.
The figure below shows a view of Enterprise Architect where the debugger has been invoked for a .NET application written in C#.
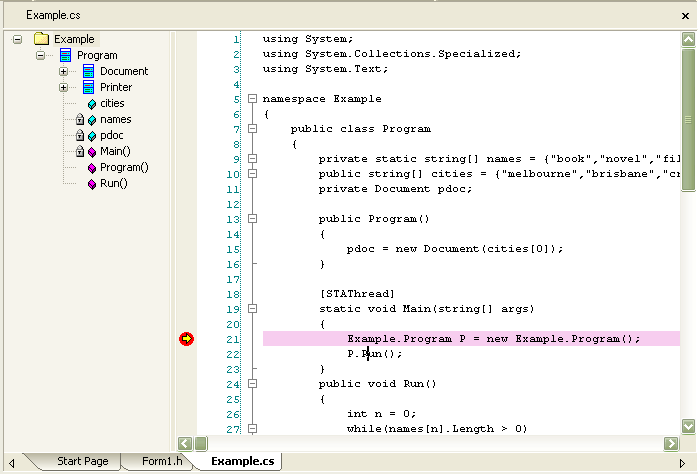
The yellow arrow ![]() and pink highlight indicate the line of execution.
and pink highlight indicate the line of execution.
When the debugger is at a breakpoint the other information is presented in the various tabs of the Debugger Workbench. The Stack tab displays the stack frames for any thread at a breakpoint, and the Locals tab displays any variables within the scope of the threads current stack frame.
Stopping the Debugger
To stop debugging click on the Stop button ![]() or press [Ctrl]+[Alt]+[F6].
or press [Ctrl]+[Alt]+[F6].
Note: In most situations, debugging ends when the debug process terminates or the java class thread exits. However, due to the nature of the Java Virtual Machine, it is necessary at times for Java developers to stop the Debugger manually with the Stop button.