


The Debug Workbench window is available through the View | Debug Workbench menu option, or by pressing [Alt]+[8]. It contains seven tabs:
| · | Module |
Breakpoints
This tab lists any breakpoints placed in the package source code, along with their status (enabled/disabled), line number, and the physical source file in which they are located.
To set a breakpoint in the code, select the View | Source Code menu option or press [Alt]+[7]. The Source Code window displays. Find the line on which to place the breakpoint in the source and click in the column to the left of the line-numbers. A round circle displays in that column to indicate that a breakpoint has been placed there (see Breakpoints).
Locals
This display shows the local variables defined in the current code segment, their type and value. (See Local Variables.)
Stack
This view shows the position of the debugger in the code. Clicking on the > button advances the stack through the code until the next breakpoint is reached. (See Stack.)
Output
Displays output from the debugger including any messages output by debugged process, such as writes to standard output. (See Output.)
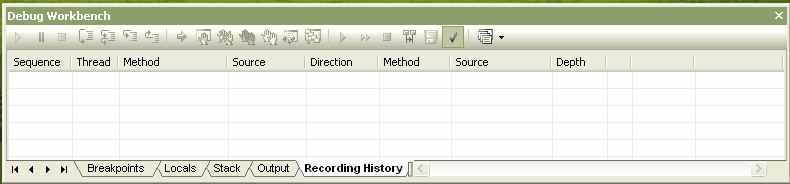
Recording History
This tab is used to record any activity that takes place during a debug session. Once the activity has been logged, Enterprise Architect can use it to create a new Sequence diagram. For more information see Recording a Debug session.
Modules
This tab displays all the modules loaded during a .Net debug session.
Workbench
This display is a place to create your own variables and invoke methods. See The Debug Workbench topic.