Now that we have a much better understanding about the static aspects of our model, we're ready to portray these in graphical fashion to complement the narrative documentation that we've developed for the SRS. We'll be using UML to produce a class diagram. Here are the rules for how various aspects of the model are to be portrayed.
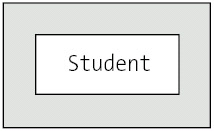
We represent classes as rectangles. When we first conceive of a class—before we know what any of its attributes or methods are going to be—we simply place the class name in the rectangle, as illustrated in Figure 10-5.
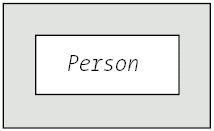
An abstract class is denoted by presenting the class name in italics, as shown in Figure 10-6.
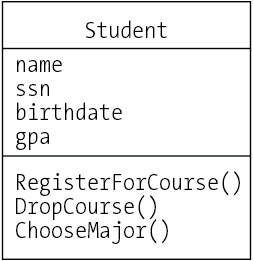
When we're ready to reflect the attributes and operations of a class, we divide the class rectangle into three compartments—the class name compartment, the attributes compartment, and the operations compartment—as shown in Figure 10-7. Note that the UML favors the nomenclature of "operations" versus "methods" to reinforce the notion that the diagram is intended to be programming language independent.
| Note?/td> |
Some CASE tools automatically portray all three (empty) compartments when a class is first created, even if we haven't specified any attributes or operations yet, as shown in Figure 10-8. |
As we begin to identify what the attributes and/or operations need to be for a particular class, we can add these to the diagram in as much or as little detail as we care to.
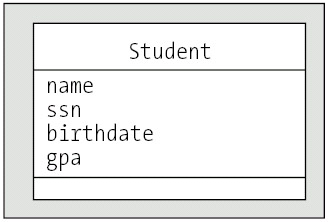
We may choose simply to list attribute names (see Figure 10-9), or we may specify their names along with their types (see Figure 10-10).
We may even wish to specify an initial starting value for an attribute, as in gpa : double = 0.0, although this is less common.
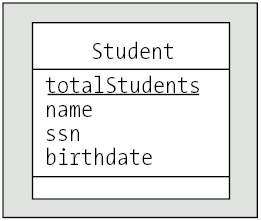
Static attributes are identified as such by underlining their names (see Figure 10-11).
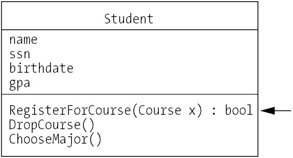
We may choose simply to list operation names in the operations compartment of a class rectangle, as shown in Figure 10-12, or we may optionally choose to use an expanded form of operation definition as we have for the RegisterForCourse operation in Figure 10-13.
Note that the formal syntax for operation specifications in a UML class diagram:
[visibility] name [(parameter list)] [: return type]
for example,
RegisterForCourse(Course x) : bool
differs from the syntax that we're used to seeing for C# method signatures:
returnType MethodName(parameter list)
for example,
bool RegisterForCourse(Course x)
Note in particular that the UML refers to the combination of operation name, parameters, and return type as the operation signature, but that in C# the return type is not part of the method signature.
| Note?/td> |
The rationale for making these operation signatures generic versus language specific is so that the same model may be rendered in any of a variety of target programming languages. It can be argued, however, that there is nothing inherently better or clearer about the first form versus the second. Therefore, if you know that you're going to be programming in C#, it might make sense to reflect standard C# method signatures in your class diagram, if your object modeling tool will accommodate this. |
It's often impractical to show all of the attributes and operations of every class in a class diagram, because the diagram will get so cluttered that it will lose its "punch" as a communications tool. Consider the data dictionary to be the official, complete source of information concerning the model, and only reflect in the diagram those attributes and operations that are particularly important in describing the mission of each class. In particular, "get" and "set" operations (whether implemented through methods or, in the case of C#, accessed as properties) are implied for all attributes, and shouldn't be explicitly shown.
Also, just because the attribute or operation compartment of a class is empty, don't assume that there are no features of that type associated with a class; it may simply mean that the model is still evolving.
In Chapter 4, we defined several different types of structural relationship that may exist between classes—associations, aggregations (a specific type of association), and inheritance. Let's explore how each of these relationship types is represented graphically.
Binary associations—in other words, relationships between two different classes—are indicated by drawing a line between the rectangles representing the participating classes, and labeling the line with the name of the association. Role names can be reflected at either end of the association line if they add value to the model, but should otherwise be omitted.
We also mark each end of the line with the appropriate multiplicity designator, to reflect whether the relationship is one-to-one, one-to-many, or many-to-many (see Figure 10-14); we'll talk about how to do this a bit later in the chapter.
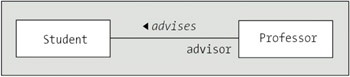
All associations are assumed to be bidirectional at this stage in the modeling effort, and it doesn't matter in which order the participating classes are arranged in a class diagram. So, to depict the association "a Professor advises a Student," the graphical notations in Figure 10-15 are all considered equivalent.

With OMT notation, a precursor notation to UML, we were instructed to label associations so that their names made sense when reading a diagram from left to right, top to bottom. There was thus an incentive to arrange classes in our diagram in whatever way would make association names less "awkward." In the preceding examples, placing the Professor class above or to the left of Student simplifies the association name. Achieving an optimal placement of classes for purposes of simplifying all of the association names in a diagram is often not possible in an elaborate diagram, however. Therefore, the UML has introduced the simple convention of using a small arrowhead (→) to reflect the direction in which the association name is to be interpreted, giving us a lot more freedom in how we place our class rectangles in a diagram, as shown in Figure 10-16.
With the UML, no matter how the preceding two rectangles are situated, we can still always label the association "advises".
| Note?/td> |
It's easy to get caught up in the trap of trying to make diagrams "perfect" in terms of how classes are positioned, to minimize crossed lines, etc. Try to resist the urge to do so early on, because the diagram will inevitably get changed many times before the modeling effort is finished. |
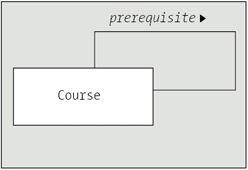
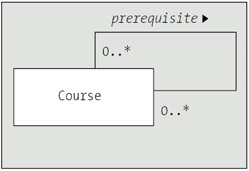
Unary (reflexive) associations—i.e., relationships between two different objects belonging to the same class—are drawn with an association line that loops back to the same class rectangle from which it originates. For example, to depict the association "a Course is a prerequisite for a (different) Course," we'd use the notation shown in Figure 10-17.
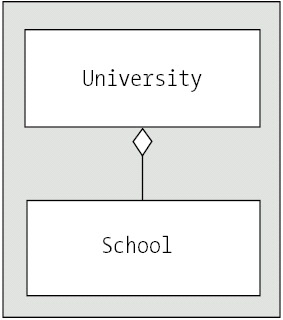
Aggregation, which as we learned in Chapter 5 is a specialized form of association that happens to imply containment, is differentiated from a "normal" association by placing a diamond at the end of the association line that touches the "containing" class. For example, to portray the fact that a university is comprised of schools—the School of Engineering, School of Law, School of Medicine, etc.—we'd use the notation shown in Figure 10-18.
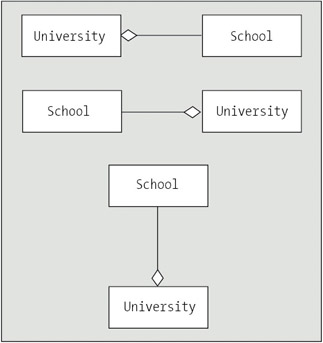
An aggregation relationship can actually be oriented in any direction, as long as the diamond is properly anchored on the "containing" class as shown in Figure 10-19.
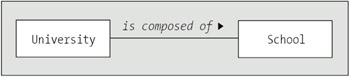
As we mentioned when we first introduced aggregation in Chapter 5, however, you can get by without ever using aggregation! To represent the preceding concept, we could have just created a simple association between the University and School classes, and labeled it "is composed of" as shown in Figure 10-20.
The decision of whether to use aggregation versus plain association is subtle, because it turns out that both can be rendered in code in essentially the same way, as we'll see in Part Three of the book.
Unlike association lines, which should always be labeled with the name of the association that they represent, aggregation lines are typically not labeled, since an aggregation by definition implies containment. However, if you wish to optionally label an aggregation line with a phrase such as "consists of," "is composed of," "contains," etc., it is permissible to do so.
When two or more different classes represent "parts" of some other "whole," each "part" is involved in a separate aggregation with the "whole," as shown in Figure 10-21.
However, we often join such aggregation lines into a single structure that looks something like an organization chart, as shown in Figure 10-22.
Doing so is not meant to imply anything about the relationship of Part A to Part B; it's simply a way to clean up the diagram.
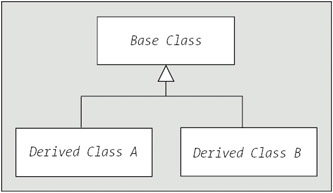
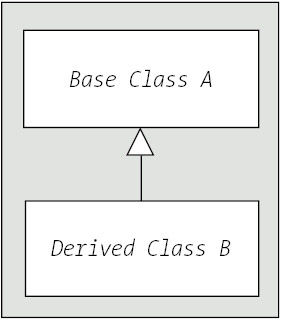
Inheritance (generalization/specialization) is illustrated by connecting a derived class to its base class with a line, and then marking the line with a triangle that touches the base class (see Figure 10-23).
As with aggregation, the classes involved in an inheritance relationship can be portrayed with any orientation, as long as the triangle points to the base class.
Unlike association lines, which must always be labeled, and aggregation lines, which needn't be labeled (but can be if you desire), inheritance lines should not be labeled, as they unambiguously represent the "is a" relationship.
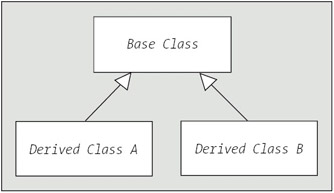
As with aggregation, when two or more different classes represent derived classes of the same parent class, each derived class is involved in a separate inheritance relationship with the parent, as shown in Figure 10-24, but we often join the inheritance lines into a single structure, as illustrated in Figure 10-25.
Doing so isn't meant to imply anything different about the relationship of derived class A to derived class B as compared with the previous depiction— these classes are considered to be sibling classes with a common parent class in both cases. It's simply a way to clean up the diagram.
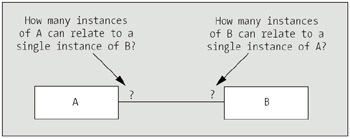
You learned in Chapter 5 that for a given association type X between classes A and B, the term "multiplicity" refers to the number of instances of objects of type A that must/may be associated with a given instance of type B, and vice versa. When preparing a class diagram, we mark each end of an association line to indicate what its multiplicity should be from the perspective of an object belonging to the class at the other end of the line: in other words
We mark the number of instances of B that can relate to a single instance of A at B's end of the line.
We mark the number of instances of A that can relate to a single instance of B at A's end of the line.
This is depicted in Figure 10-26.
By way of review, given a single object belonging to class A, there are four different scenarios for how object(s) of type B may be related to it:
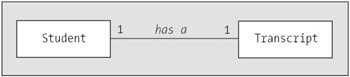
The A type object may be related to exactly one instance of a B type object, as in the situation "a Student (A) has a Transcript (B)." Here, the existence of an instance of B for every instance of A is mandatory.
The A type object may be related to at most one instance of a B type object, as in the situation "a Professor (A) chairs a Department (B)." Here, the existence of an instance of B for every instance of A is optional.
The A type object may be related to one or more instances of a B type object, as in the situation "a Department (A) employs many Professors (B)." Here, the existence of at least one instance of B for every instance of A is mandatory.
The A type object may be related to zero or more instances of a "B" type object, as in the situation "a Student (A) is attending many Sections (B)." (At our hypothetical university, a Student is permitted to take a semester off.) Here, the existence of at least one instance of B for every instance of A is optional.
With UML notation, multiplicity symbols are as follows:
"Exactly one" is represented by the notation "1".
"At most one" is represented by the notation "0..1", which is alternatively read as "zero or one."
"One or more" is represented by the notation "1..*".
"Zero or more" is represented by the notation "0..*".
We use the notation "*" when we know that the multiplicity should be "many" but we aren't certain (or we don't care to specify) whether it should be "zero or more" or "one or more."
It's even possible to represent an arbitrary range of explicit numerical values x..y, such as using "3..7" to indicate, for example, that "a Department employs no fewer than three, and no more than seven, Professors."
Here are some UML examples:
"A Student has exactly one Transcript, and a Transcript belongs to exactly one Student." (See Figure 10-27.)
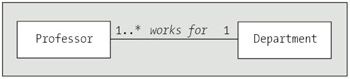
"A Professor works for exactly one Department, but a Department has many (one or more) Professors as employees." (See Figure 10-28.)
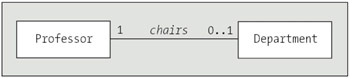
"A Professor optionally chairs at most one Department, while a Department has exactly one Professor in the role of chairman." (See Figure 10-29.)
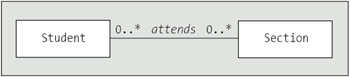
"A Student attends many (zero or more) Sections, and a Section is attended by many (zero or more) Students." (See Figure 10-30.)
| Note?/td> |
A Section that continues to have zero Students signed up to attend will most likely be cancelled; nonetheless, there is a period of time after a Section is first made available for enrollment via the SRS that it will have zero Students enrolled. |
"A Course is a prerequisite for many (zero or more) Courses, and a Course can have many (zero or more) prerequisite Courses." (See Figure 10-31.)
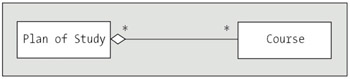
We reflect multiplicity on aggregations as well as on simple associations. For example, the UML notation shown in Figure 10-32 would be interpreted as follows: "A (Student's) Plan of Study is comprised of many Courses; any given Course can be included in many different (Students') Plans of Study."
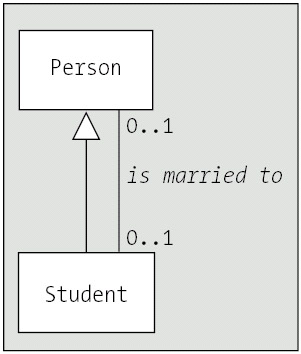
It makes no sense to reflect multiplicity on inheritance relationships, however, because as we discussed in Chapter 4, inheritance implies a relationship between classes, but not between objects. That is, the notation shown in Figure 10-33 implies that any object belonging to Derived Class B is also simultaneously an instance of Base Class A by virtue of the "is a" relationship.
If we wanted to illustrate some sort of relationship between different objects of types A and B, e.g., "a Person is married to a Student," we'd need to introduce a separate association between these classes independent of their inheritance relationship, as shown in Figure 10-34.