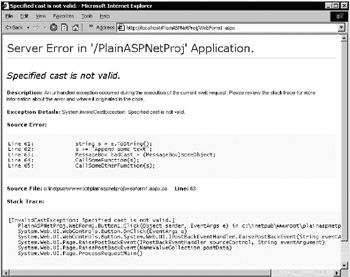
The first debugging improvement most developers notice is the quality of error messages when a bug does happen. With ASP, we got "A runtime error occurred" message boxes, and maybe a line number if we were lucky. But in ASP.NET, we get wonderfully detailed reports about exactly what went wrong, as shown in Figure 6-1.
| Note |
By default, you'll only get those detailed error messages when accessing the page from a web browser on the local machine. But you can change that if you want through an option called customErrors in your Web.Config file. |
Bjarne Stroustrup, the creator of C++, said, "Prefer compile-time errors to run-time errors," and the compiled nature of ASP.NET fulfills that mantra. Compilers can check many things for you—they can warn you about syntax errors, undefined variable names, an incorrect number of function arguments, etc. If your code successfully compiles, you know you don't have any bugs of that type. It's physically impossible to deploy compiled code with those types of bugs. You might have bugs of some other type, of course, but at least the compiler prevented an entire class of problems from appearing in your code.
Contrast that to classic ASP, where you wrote the code and could never be sure it was syntactically correct until you tested every possible code path. Even a bug as simple as
<%
  Dim somethingThatIsTrueOnlyVeryRarely
  SomethingThatIsTrueOnlyVeryRarely = false
  If somethingThatIsTrueOnlyVeryRarely Then
      CLEARLY INCORRECT
  End if
%>
would go undetected until you ran a test case that exercised that code path. If you didn't think to test that very rare case, then the bug might slip by into deployment, and users would see an annoying runtime error message. But there's no excuse for a bug as obvious as that getting by. Merely running the code through a compiler would have alerted you to this basic error.
Don't resent having to compile your ASP.NET code. It only takes a few seconds, and the security you gain by auto-detecting a huge class of bugs is well worth the cost.
This vastly improved error information is a direct result of a controversial change in ASP.NET: compiled code. Many scripters loved the convenience of hand-editing ASP files directly on a production machine without having to fuss with a compiler. Those scripters weren't so sure about compiled ASP.NET. But Microsoft held firm on this point because compiling provides so many benefits: improved performance, detection of many bugs at compile-time, and a much better debugging experience.
The other debugging nicety that developers quickly notice is how much better ASP.NET pages work in a debugger than classic ASP pages did. Yeah, Visual Interdev sometimes let you debug by setting breakpoints on your ASP code, but it never quite matched the seamless debugging experience of the Visual Basic IDE. But the ASP.NET debugger works exactly the same as the C# or VB.NET debugger. Just set breakpoints on your code, start the process running by clicking Start on the Debug menu, and then you can debug your ASP.NET code as easily as any other project.
In addition to letting you start a new ASP.NET process running, VS.NET also allows you to attach the debugger to an already running process. This can be extremely useful. Sometimes, a bug appears on a web server that can't be duplicated in your test lab. By attaching the debugger directly to the process on that offending machine, you can see exactly what is going wrong, which will save you tons of work trying to figure out the differences between that machine and your own.
If you're very lucky, you might even be able to fix the problem through the debugger without restarting the process. Suppose an ASP.NET page has a bug that prevents a while loop from ever terminating. By attaching the debugger to the already running process, you'll be able to see this problem, but even better, you may be able to use the debugger's Set Next Statement feature to move the execution out of the infinite loop. Then you may be able to use the debugger to change the values of each variable to an acceptable state. Finally, detach the debugger knowing that the program can now continue correctly. That will buy you time to fix the bug for real. Not all bugs respond to this treatment, but some do.
Based on what we've discussed so far, it's natural to assume VS .NET allows debugging of ASP.NET pages running on a production web server. Maybe it can. But not always. The core issue is that you'll only be able to use the debugger on projects that were compiled with the Generate Debugging Info option turned on. By default, that option is off for Release mode builds, yet it's the Release builds that are generally installed on production machines.
Of course, you can turn on that flag for Release builds. If you do that, and if you also copy the.pdb debugging files to the production machine, then this will enable you to debug the files. But this process isn't perfect, because Release builds usually have a degree of optimization enabled that occasionally confuses the debugger. You'll be stepping through code and suddenly the debugger appears to skip over a line. That's to be expected when debugging Release builds. Still, as long as you don't expect perfection, debugging Release builds on a production machine can work well enough to be worthwhile.
To create debugging information for your Release builds, go to the project's settings, select Configuration Properties ![]() Build, and then change the Generate Debugging Information flag to true. There's essentially no cost to doing this, and I'd recommend always doing it. However, you might not want to ship the resultant.pdb debugging files to your customers. They contain important debugging information that will make it easier for your competitors to reverse engineer your code.
Build, and then change the Generate Debugging Information flag to true. There's essentially no cost to doing this, and I'd recommend always doing it. However, you might not want to ship the resultant.pdb debugging files to your customers. They contain important debugging information that will make it easier for your competitors to reverse engineer your code.
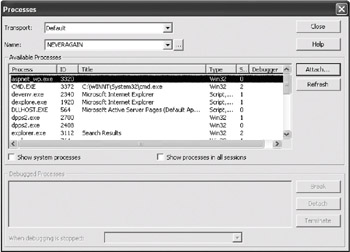
To attach the debugger to a running process, go to the Debug menu and select Processes. You should see a list of all the debuggable processes (see Figure 6-2), so just select the one you want and press the Attach button. In the case of ASP.NET pages, the process you want is called aspnet_wp.exe.
Once VS .NET is attached to the ASP.NET process, everything is easy. Open the source code file you want by using the File ![]() Open command. Set your breakpoints, and the debugger will stop the program execution as soon as one of those breakpoints is reached. From there, you have access to all the standard debugging features: watch windows, Set Next Statement, and so on. Attaching to a running process is sometimes a useful feature for debugging processes on your own development machine. But where this feature really shines is when you combine it with VS .NET's remote debugger to attach to processes that are already running on other people's computers.
Open command. Set your breakpoints, and the debugger will stop the program execution as soon as one of those breakpoints is reached. From there, you have access to all the standard debugging features: watch windows, Set Next Statement, and so on. Attaching to a running process is sometimes a useful feature for debugging processes on your own development machine. But where this feature really shines is when you combine it with VS .NET's remote debugger to attach to processes that are already running on other people's computers.
Visual Studio 6 included a remote debugger, but it was so difficult to use that very few developers even knew that it existed. Things have changed with VS.NET. Now, setting up remote debugging is a breeze. But before we talk about what the remote debugger can do, let's first talk about what it can't do very well: debug issues at remote customer sites. Unfortunately, the remote debugger is primarily a tool for debugging problems that occur inside your company. There are four main limitations preventing "true" remote debugging:
Because it would be a security hole to allow anyone to debug programs, you need to give your logged on account various permissions on the remote computer in order to debug. This means your two computers must be in domains that trust each other, but that's seldom an option with most customers.
Live software systems often have confidential information stored in their databases. Your customers may be reluctant to give you free rein with a debugger over their program, because that would allow you to access their private data.
You probably shipped your customers a Release version of your software without debugging symbols. In order to use the remote debugger, you'll need to send them a new version with debugging symbols.
The customer must be willing to install the Remote Components debugging software on her production machine. Many customers balk at this. System administrators are often hesitant to install any non-essential software since each additional piece of software increases the risk of a potential security hole being added to the system.
On the other hand, those conditions are easily worked around on projects running inside your own company. So the remote debugger can be extremely useful for debugging problems on a coworker's machine, for instance. Connecting to a remote process is easy. Notice VS.NET's Processes dialog box (Figure 6-2) has a drop-down list box called Name. That's where you'll enter the name of the computer you're interested in. Type a remote machine and you're ready to debug. Once everything is set up, remote debugging works exactly like local debugging. You have access to all the same features, and the IDE itself will look the same, too.
When you're finished debugging, you can either terminate the aspnet_wp.exe process, or detach from it. Detaching a debugger is a brand new feature in VS .NET. Before VS .NET, the only way to end a debugging session was to end the process. That's especially inconvenient when debugging mission-critical processes on a production machine.
To detach from a process, go to the Debug menu and select Processes. At the bottom of the window, there is a list of attached processes and a button labeled "Detach". All you have to do is click the button—well, unless the button is disabled. By default, you can detach from any local.NET process, but not from any unmanaged native process or remote process. By default, the Detach button will be grayed out for those cases.
Happily, though, you actually can detach from those processes, too. But it takes a tiny bit of preparation—you have to start the Visual Studio Debugger Proxy service (dbgproxy.exe) first. This service is installed with VS .NET, but by default, it isn't started. Once you start it running on the local machine, though, you'll be able to detach from unmanaged native processes. And once you start it running on a remote machine, you'll be able to detach from remote processes, too. I usually set the startup type of this service to "Always"—that way, it's guaranteed to be available when I need it.
Try out the detach debugger feature for yourself. You'll find it's a very handy tool for allowing "non-intrusive" debugging that was never before possible.
Have you ever debugged C++ COM components from a program written in Visual Basic 6? In .NET, stepping across language boundaries is no problem at all; but in legacy VB6 and Visual C++ 6 that wasn't so easy. So to debug my legacy C++/VB mixture projects, I loaded the VB6 IDE and started the VB debugger on my project. Then I attached the Visual C++ debugger to the VB6.exe process, loaded the C++ files from my COM component into that project, and set breakpoints on my files. Switching back to the VB6 IDE, I could now run my VB program, knowing that my C++ breakpoints would be hit.
The biggest annoyance of all this, though, was that there was no way to detach the Visual C++ debugger from VB6.exe. When you finished debugging, you had no choice but to kill the VB6 IDE. So when VS .NET announced the ability to detach the debugger from a process, I immediately dreamed of using it for this purpose. By attaching the VS .NET debugger to VB6.exe, I was still able to debug my C++ code; yet at the end, I merely detached the debugger and then happily went back to VB6.
Even if you haven't yet moved to .NET and you're still coding in traditional Visual C++, consider switching to VS.NET anyway. You can still work in unmanaged C++, plus you get all the new features of the IDE.