In addition to using the debugger to troubleshoot ASP.NET, we'll also need to consider other forms of debugging—in particular, logging. In Chapter 5, we used the
Trace and Debug classes for logging in traditional .NET applications. You can use those classes to do logging in ASP.NET, too. The rules for using these logging classes in ASP.NET are very similar; about the only noticeable difference is in the XML config file. Isn't it great that .NET allows you to reuse the logging API you learned for one project in different projects?
Except you may not want to. Although you can use the Trace and Debug classes in ASP.NET pages, another logging API is exposed that may be better for web page development. Traditionally, web pages and applications have been written by two very different classes of programmers. ASP.NET closes the gap a little by bringing far more structure to web development, but even so, the logging needs of a web page are a bit different from those of an application. Among the chief differences:
Each web page is relatively standalone. Anything that happened on the previous page usually (though not always) doesn't matter. In contrast, applications require a more holistic approach to debugging, and logs that go back to the very beginning of the program.
Some applications have multiple users connected simultaneously, but all web pages are like that. Traditional logging gets confusing when multiple users write debugging info at once. But ASP.NET logging makes it trivial to see the debugging output for just any one particular user at a time.
When debugging web pages on a remote server, it's convenient to view the logs remotely with a web browser, too. Traditional logging doesn't easily support this.
Each web page maintains a great deal of information by default—the list of cookies, the querystring, information about the controls on the page, etc. We want this data to be automatically integrated into our debug logs.
Traditional applications are usually installed on servers that the developer can't directly interact with. So application logs tend to be long and wordy, since the developer needs to gather everything that could be relevant in one shot. Web pages are often installed on a server the developer can access. The logging can be less verbose (and hence, easier to read), since additional logging can be added if needed.
To solve all these issues, ASP.NET provides an alternative logging class called the TraceContext. Unlike the Trace and Debug classes from Chapter 5, which mix all the logging from the program into one file, the TraceContext will create one log file for each view of each page.
The first thing we need to do is enable tracing for the ASP.NET page we want to debug. This is very easy to do—it requires adding only a single line to either the page or the XML config file. But before we turn tracing on, let's first look at all the debugging information that tracing gives us. Keep in mind that all the following data was automatically provided by ASP.NET by changing just one line of code. Even though the data normally appears on a single web page, I've split it into smaller chunks here so that we can discuss each item one by one.
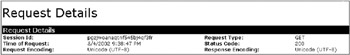
This is basic stuff: the time the web request was submitted, the encoding (for example, Unicode vs. ASCII), whether the web request was a GET or POST, etc. When debugging, you probably won't need this information very often. The only one of these fields that I've ever used to solve a bug was Session ID—a random number that identifies a user across multiple pages. Remember that each ASP.NET log corresponds to a view of a single page by a single user, so if you ever notice a list of logs and need to know which ones were by a particular person, Session ID is one way to figure that out.
| Tip |
Although the Time Of Request field probably won't help you solve any bugs, you should always at least glance at it every time you read an ASP.NET log. An extremely common mistake is to waste time by accidentally reading an old log instead of the one you care about. A quick sanity check on the Time Of Request field eliminates this error. |
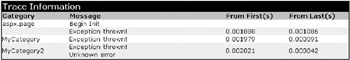
This is by far the most important section. This is where you write all your logging messages as described in Chapter 5—for instance, "Now entering function such- and-such", or "Value of foo is 6". All the guidelines we discussed for deciding what to write to a log apply here, too, and we'll discuss which APIs to use for writing to this section in a few minutes. But for now, look at the four columns. The Message column is obviously the text you want to write. No mystery there. Category is straightforward, too: a user-defined string listing the type of message or source of message or whatever other convention the developer chooses. If you want, you can have ASP.NET sort your log messages based on the Category string instead of the time.
But many programmers find the From First(s) and From Last(s) columns aren't quite as intuitive. These columns work as a primitive profiler, allowing you to see how much time each part of your code is taking. The names are confusing, though. From First(s) means the elapsed time (in seconds) since the very first trace statement was written—in other words, the amount of time from when the page started loading. Use this number to estimate how long your pages take to load.
The From Last(s) field is the amount of time that elapsed between writing the previous log statement and this one. From Last(s) isn't strictly necessary since it could be derived by looking at From First(s). But having the number explicitly displayed is convenient. When you need to identify the slowest part of your page load, just look at the From Last(s) column. Find the item that has the greatest value, and you'll know the majority of time was spent between that statement and the previous one. Use this information to optimize your code.
| Tip |
On fast operations, the time between one log statement and the next may be mere milliseconds, a very small amount of time. Don't forget that timing an interval that small is difficult because random factors tend to produce "noise" that drowns out the true timing. |
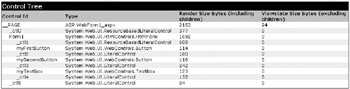
Before.NET, we used to call this the DOM. The name has changed, but the idea is still the same. This section lists all the controls on an ASP.NET page, and identifies which controls are nested inside others. At first glance, this seems trivial—can't anyone see all the controls merely by viewing the output page in a browser? The answer is no. Remember that some controls may be invisible, such as the RequiredFieldValidator, and other controls may look like buttons and text boxes, but actually be derived classes that behave completely differently.
On simple ASP.NET pages, the page controls (buttons, text boxes, etc.) are dragged and dropped on an ASP.NET WebForm, or by carefully writing HTML by hand. Then you write script code to establish what those controls do, but the layout of the controls is set at design time. Viewing the control tree for that type of page is probably only marginally useful. But on more complex ASP.NET pages, the controls themselves are generated by script code at run-time. For those pages, being able to easily view a hierarchical list of all the controls with their names and types can save hours of frustration.
| Tip |
Also note two of the columns in this section show the byte size of each control. This can help you understand where the bulk of your page's download size is going, so you can optimize. A simple control like a button or a text box will always be small and fast to download, but custom controls may be significantly larger, and this section can help you discover such problems. |
Cookies are a common way for web servers to store information about a user from one session to the next, and most web developers have been using them for years. Getting the values of all cookies associated with a page wasn't too difficult in ASP, but ASP.NET makes it even easier by including the list along with the other debugging output. For instance, the preceding example shows a single cookie representing a session ID—ASP.NET automatically puts that on every page for you.
Debugging problems with cookies is usually straightforward. Cookie values tend not to change very often, so usually the cookie is either present (and correct) or just not present at all. Cookie bugs tend to be relatively benign, too. After all, your web page obviously needs to be able to deal with first-time users who've not yet had any cookies set. So even if your page has a bug that fails to set the cookie on the user's machine, the user will still be able to use your web site as if he were a first-time user (although he might have to re-enter data that he already entered in the previous session.) Despite that, though, it is convenient to see a list of cookie values in one place.
| Tip |
The only "interesting" cookie bug I ever saw was a poorly designed web site that required cookies for even basic navigation. This worked until a user who had disabled cookies for privacy reasons visited the web site. Moral of the story: Don't write pages like that. But if you must do it, use this logging feature to see whether cookies are being correctly set. If a particular user's cookies are showing up empty, then maybe she has cookies disabled. |
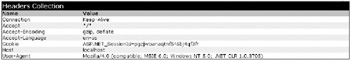
Depending on the type of work you're doing, you may find some of these fields useful. However, there is one field everyone will find useful: The User-Agent field is essential for debugging. That field is how you can detect what version web browser the client is using. Have you ever seen a web page that rendered correctly with one browser, but looked ugly in a different browser? Even a different version of the same browser can make the page look strange. Many web pages follow different code paths depending on the contents of the User-Agent field, so when debugging those pages, you'll be glad you can see this field in the debugging output.
Microsoft spent a lot of time making sure the ASP.NET server controls generate standard HTML that renders correctly with non-Microsoft browsers. You won't have any problems there. But if you're not careful, your own code might not live up to the same standards. Besides, as we'll see in Chapter 7, a very important debugging step is to gather information about the configuration, and the User-Agent field can be a huge step in that direction.
| Tip |
Notice the User-Agent field identifies which version (if any) of the .NET CLR is installed on the client machine. Most ASP.NET pages can be viewed even if the client doesn't have.NET. But some advanced features require the CLR on the client, so this field gives your page a way to discover whether it's safe to use those advanced features with this particular client. |
This section will only appear on WebForms that have had data posted back. Remember how in ASP any postback to a page would clear out all the text in text boxes unless the programmer had written code to specifically deal with that case? ASP.NET provides a helpful way around that—merely add the <runat=server> tag to your controls, and their values will be preserved even after a postback. This section of the debugging output is where you can view those values, and it tells you what values the page thinks it should use to populate the controls.
I've never had the occasion to use any data in this section while debugging, because .NET's postback code always just works without my having to bother with it. I think this section might be useful for determining what input the user entered, but I'm usually able to get that by looking at the Trace Information section. On the other hand, one of the fundamental rules of debugging is that all information is useful, and you never know when that one obscure piece of data will be the key to unlocking a puzzle. Maybe this section will be exactly what you need to solve one of your bugs.
This section will appear only if the web page was invoked with a querystring in the URL. You remember querystrings, right? Instead of http://www.foo.com/index.html we use http://www.foo.com/index.html?myRequestString=1. Of course, when debugging, it's easy to get this information simply by looking at the address bar in your browser. So it's not immediately obvious why this section is necessary. But there are a few situations where you might find it difficult to get the querystring without this section.
If your page is one of several contained in a set of frames, then the browser's address bar will show the address of the frameset page, not the address of your page.
If your page's querystring is very long and has many arguments, you'll find it easier to view a table of name-value pairs rather than a single string that runs on forever.
Maybe some other user discovered a bug and you're not sure what querystring to use in order to reproduce that bug. Check the log for that user's viewing of the page, and you'll know exactly what input was used.
If your pages use querystrings, then this section can be very useful.
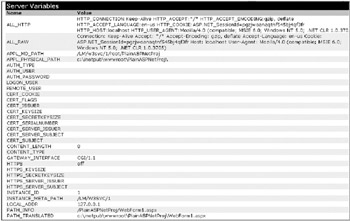
Here's a bunch of random stuff. We're starting to get into advanced areas, though. If your web site requires a digital certificate, then you might find the CERT fields helpful; I once had to check the AUTH fields for something. But other than that, most web developers probably won't need to view this information for debugging purposes very often. If you know what the preceding fields mean because you've used them, then having this information packaged up nicely in one place is a godsend. However, if you don't already know what these fields mean, then you probably won't ever need them when debugging.
So how do we make ASP.NET display the tracing information? We can enable tracing for either a single page or for the entire ASP.NET project. To enable it for a page, make the following change to the @page directive:
<%@ Page Language="C#" Trace="true"%>
To enable tracing for an entire project, add the following lines to the Web.Config file under the <system.web> section. (Actually, you probably don't need to add these lines—they're already there by default in most cases, so you may need do nothing more than switch the part that says enabled="false" to enabled="true".)
<trace
  enabled="true"
  requestLimit="10"
  pageOutput="false"
  traceMode="SortByTime"
  localOnly="true"
/>
In either case, that's all you have to do to make ASP.NET start producing debugging output. Unlike the logging from the Trace and Debug classes (which only log what you tell them), the ASP.NET logging will automatically display useful information right out of the box. You might expect the logging would be displayed on the regular web page, interspersed with the regular text—workable, but difficult to read for the developer. (That logging would also be highly confusing to any user who happened to get the debugging-enabled page.) Fortunately, ASP.NET tracing is smarter than that. By default, the debugging information is sent to a separate page, so you get all the data you need clustered in one spot.
You can set additional options on the Web.Config file for even more fine- grained control of the tracing. These options are listed in Table 6-1.
|
Option |
Meaning |
|---|---|
|
enabled |
Do you want tracing turned on? Choose "true" or "false". |
|
pageOutput |
If this is set to "true", then the debugging output will be displayed on a separate page from the regular page output. But if this value is "false", then the debugging output and regular output will appear on the same page. |
|
requestLimit |
The ASP.NET server will "remember" only a certain number of debugging logs. You can control the number here. The default is 10. |
|
traceMode |
The information in the Trace Request section can be sorted either by time (the default) or by category. Choose either the string "SortByTime" or "SortByCategory". |
|
localOnly |
If this is set to "true", then you will only be able to see the tracing logs when your browser is on the same machine as the web server. But if this is set to false, then anyone can see the tracing logs. |
Regardless of the selected options, though, it's very important to remember that each ASP.NET trace log describes only a single view of a single page by a single user. This is in marked contrast to the way that the logging provided by the Trace and Debug classes works. Those logging classes record the entire history of the application from start to finish.
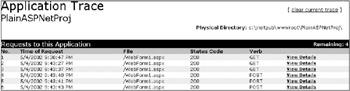
It's not an obvious question, but how do we get to the trace logs that ASP.NET creates? By default, the trace logs are written to a different page from the regular output, so where do we look for those pages? The answer is that ASP.NET creates a hidden page in your project directory called trace.axd. From here, you can see logs for the last ten pages that were served. (Ten is the default, but you can change the number via the options in the Web.Config file.) In Figure 6-3, I've viewed the same page six times, but if I'd been viewing multiple pages, then all the different pages would be listed here.
Remember that by default, you'll only be able to see the trace.axd page by running a web browser directly on the web server machine. You can easily change that in the Web.Config file if you want to look at the logs from a different machine, but it's easy to forget about this step.
The one part of the ASP.NET trace log that you can directly write to is the Trace Information section. To do this, you use a logging class called TraceContext. You don't have to create a new instance of this class because one is already associated with the Page object—it's named Trace. But be careful not to confuse this Trace member variable with the Trace class we discussed in Chapter 5. Trace and TraceContext are two entirely different classes. (See the "Using Trace and TraceContext Together" sidebar.)
It sometimes makes sense to use both the standard Trace logging class and the ASP.NET TraceContext logging class in the same ASP.NET page. Why would you do this? ASP.NET tracing provides a log of only a single view of a page, while standard tracing provides a log of the entire run of a program. See the difference? Anytime you want a "temporary" log about details that only matter for this particular page view, you'd use ASP.NET logging. But if you want logging from any page view by any user consolidated to the same log file, then you would use the Trace class.
There's only one detail to watch for. The Page object has a TraceContext member variable called Trace, but that also happens to be the name of the Trace class. Fortunately, namespaces solve this problem. Make sure you type
System.Diagnostics.Trace.WriteLine("Whatever"); //Standard logging
Trace.Write("Whatever2"); //ASP.NET logging
rather than trying to shorten it:
using System.Diagnostics;
Trace.WriteLine("Whatever"); //Standard logging
Trace.Write("Whatever2"); //ASP.NET logging
If you try to take the latter approach, the compiler won't be able to tell whether Trace refers to the Trace class or the TraceContext class member variable of the page.
The TraceContext class has two important methods (each with several overloads), described in Table 6-2.
|
Name |
Description |
|---|---|
|
Write |
Writes a message to the Trace Request section of the ASP.NET log |
|
Warn |
Exactly the same as Write, except the text will be highlighted in red |
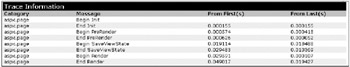
Use Write for logging normal informational messages. Use Warn for logging messages that are so important that you want them to jump out of the screen. The two functions are identical except for the color of the output. But in either case, you have several overloaded methods to choose from. You can log just the message, or you can log the message with a category string, or you can log the message with a category string and the description from an exception object.
catch(Exception e)
{
    Trace.Write("Exception thrown!");
    Trace.Warn("MyCategory", "Exception thrown!");
    Trace.Write("MyCategory2", "Exception thrown!", e);
}
Easy, huh? That will produce a trace log that looks like the one shown in Figure 6-4.
There's only one remaining issue with ASP.NET logging. Many ASP.NET pages will invoke.NET components to do work. How do we do logging from those components? Of course, you could fall back to the standard Trace and Debug classes, but then the log data will be put in a different file from the regular ASP.NET logs. Can we send the logging data from a component to the log we want? Remember that each ASP.NET log represents a single view of a page (known as a context), and so our component needs to have some way to figure out what the current context is. Fortunately, the System.Web class library is able to accomplish this nicely, as demonstrated here:
using System.Web;

  public class MyComponent
  {

    public void SomeFunction()
    {

      HttpContext.Current.Trace.Write("Whatever");
      ... //Do stuff
    }
  }
Now any messages logged by that component will be written to the appropriate ASP.NET log.
If your component may be used in traditional apps as well as ASP.NET pages, then your code needs to test whether the HttpContext.Current object is null before accessing the Trace member variable. Obviously, there is no current context for non-web applications!