Traditionally, debugging SQL stored procedures has been very difficult. But one of the nicest additions to VS .NET is the ability to create, view, and debug every aspect of your SQL Servers—including stored procedures. You can debug your stored procedures by setting breakpoints on them and running your application, or you can step into the stored procedure directly. And without loading another tool, VS.NET can even let you browse the data in your database, create new tables or triggers, and edit the schemas. All of this is done via the Server Explorer window.
| Tip |
You can access the Server Explorer window under the View menu. Then right-click the Servers tab to add a new server. |
This chapter has been primarily focused on ASP.NET, and I've included this discussion of SQL debugging here because the majority of ASP.NET pages make use of a SQL database. The two topics fit each other well. But don't think these SQL debugging techniques can be used only with ASP.NET. Many traditional applications use databases, too, and everything discussed in these pages can be applied towards those applications, as well.
Let's create a stored procedure and step into it. We'll create our procedure on the SQL Server running on the local machine—later, we'll see how to enable remote SQL debugging. On the Server Explorer window, go the Stored Procedure section, right-click, and select New Stored Procedure. The wizard should fill in a template that looks like this:
CREATE PROCEDURE dbo.StoredProcedure1
/*
(

  @parameter1 datatype = default value,
  @parameter2 datatype OUTPUT
)
*/
  AS
    /* SET NOCOUNT ON */
    RETURN
We'll fill that in with some code. In this particular example, our code won't do anything useful, but it will demonstrate VS.NET's new debugging abilities.
ALTER PROCEDURE dbo.UselessProcedure
(    @parameter1 INT = 10    )
AS
    /* A calculation that doesn't do anything useful */
    DECLARE @var1 INT, @var2 INT
    set @var1 = 10;
    set @var2 = @parameter1 * @parameter1;
    set @var2 = @var1 * @var2;
    RETURN
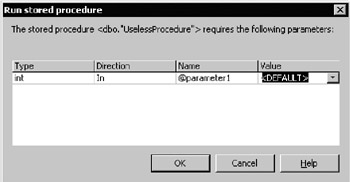
Press Ctrl-S to save that code, then look at the Server Explorer window again. You should see this procedure listed under the Stored Procedures node. Right-click and select Step into stored procedure. You'll get a dialog box where you can specify the input parameters (see Figure 6-5).
Once you select that, then you'll be able to step into the procedure, view variable values, and debug just as you would with regular VB.NET or C#. A few things are missing from the SQL debugger, however. In particular, there is no Set Next Statement command to change the execution flow of the procedure. Still, that's a small price to pay considering how far ahead this debugger is over what we used to have before VS .NET.
You can also set breakpoints on your stored procedure and then run your application, waiting for the breakpoint to be hit. You can do this for SQL Triggers, as well. But this feature is not turned on by default. Go to the Properties page of your project, select the Configuration Properties node, select Debugging, and then make sure Enable SQL Debugging is set to true. Without this, the breakpoints on your stored procedures and triggers will not be hit.
What's the downside of enabling SQL debugging? Only a very tiny bit of debugger performance. If that flag is enabled, the debugger will need to make a connection to the SQL Server, slightly slowing things down. But if you need to debug SQL, go ahead and turn on this option and leave it on. The performance cost is very slight, and you probably won't even notice.
Visual Studio .NET even allows debugging stored procedures on remote machines. But there are a few things you have to set up first.
Install the Remote Components on the remote SQL Server. You can find these components on the VS .NET CD.
The account you are debugging with must be a member of the System Administrators server role on the remote SQL Server.
You may need to alter the DCOM permissions on the SQL Server machine to allow your debugging account access. Unfortunately, this involves several steps that are dependent on your version of Windows. In MSDN help, search for "Configuring DCOM for SQL Debugging" and follow the steps described there.
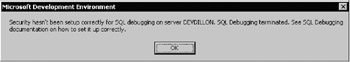
Once you've carried out these steps, though, you should be able to debug remote SQL Servers. The most common source of problems is failing to properly configure DCOM in step 3. If you see the error displayed in Figure 6-6, then run dcomcnfg.exe and review the permissions.
Visual Studio .NET has made it easy to use the debugger in situations not possible with Visual Studio 6: in web pages, remote debugging, and SQL debugging. The more I use the VS .NET debugger, the more impressed I am with it. But before you get too attached to the debugger, always remember to keep your other debugging skills sharp because there are still some situations when the debugger can't be used—in particular, when debugging issues at remote customer sites. We'll discuss techniques for dealing with that problem in the next chapter.