Once we have agreement on the application requirements with our customer, it is time to start generating our UML models. We cannot show all the models and use cases of this application in this book, however, so we have chosen to follow one specific use case. Here we will concentrate on how a project member registers a time report. We can now move on to our activity diagrams.
Before we start with the use case, we will spend a few moments on some activity diagrams we need to make early in the process. These diagrams will give us a good picture of what we are attempting to build. We will then follow these diagrams through our examples and see how they evolve.
You can create activity diagrams whenever you want during the modeling and use them to explain a flow simply, when something needs to be clarified. We often use them to show a customer or decision maker what will happen in the application.
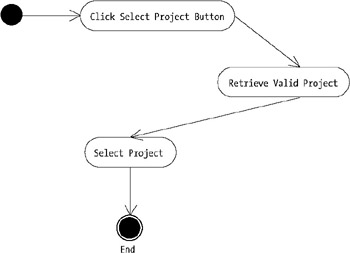
Figure 9-1 shows an activity diagram for when a user selects a project to report time on.
The user clicks Select project on the screen. The system then checks for valid projects and subprojects for the user and displays them on the form. The user selects the correct project, and the flow ends.
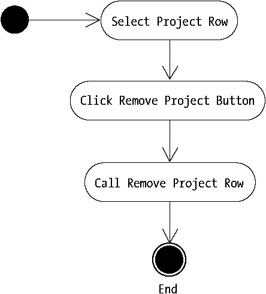
The next activity diagram, shown in Figure 9-2, maps out what happens when a user wants to remove a project row from the week report.
This is a very simple example. The user selects the correct row for deletion and clicks the remove button. A call is made to the remove project row function and the flow ends. What the remove project row function will do in real life is check to see if the report has been saved previously. Because if it has, we need to update the information in the database as well.
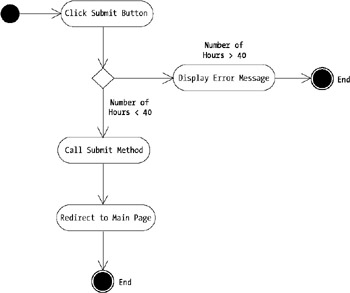
Now you will see a more complex activity diagram. The diagram in Figure 9-3 shows what happens when a user submits the report.
When a user is finished with the time report, the report must be submitted for approval by a manager. The user clicks the submit button, and the application checks the number of normal hours the user has reported during the week. If the amount is not 40, an error message will be displayed and the flow ends. (Remember that 40 hours is a normal week, but if a week has a holiday in it, the amount can vary.)
If the user has reported 40 normal hours, the Submit method is called, and information about the report is saved to the database. An e-mail is sent at the same time to the manager, who can then open the report for approval. After submission, the user is redirected to the main page again.
As you can see, this is pretty straightforward, and if we use this kind of simplicity, it is easier to reach consensus with the customer so no disagreements will occur at the end of the project.
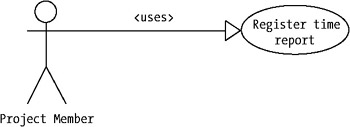
Now we are going to find our actors. To simplify things, we only show one actor here: the project member (see Figure 9-4). Other actors in our system might be administrators, project managers, and so on. After we have identified our actors, we can start finding our use cases.
To determine the use cases, we ask ourselves why our actor(s) want to use the system. What is it that the system can do for our users? In our case, the whole idea behind the system is for our users (project members) to report their time in the application. In order to do this, they must register a time report. When a user enters information about the report and clicks the submit button, the system registers the report via one of its functions. In other words, a project member uses the register time report function the system offers. This means we have found a use case to follow, as shown in Figure 9-5.
Once we have a use case to work with, it is time to start documenting it. What is it that really happens when a user registers a time report? We need to find the flow of events for the process.
Sequence diagrams are used to illustrate interaction between the objects in a model in a chronological order. They also show the messages sent between objects. This gives you a dynamic view of a system so you can see (and show others) what is going on.
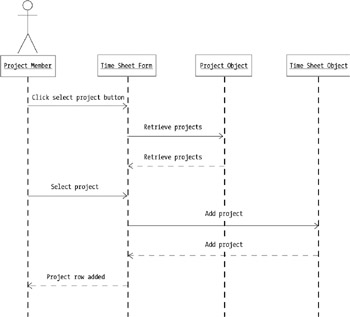
We are going to examine three sequence diagrams here, which are all parts of the flow described earlier. The first one is shown in Figure 9-6, and depicts what happens when a user selects a subproject for the time report he or she is working on.
The objects that participate in this sequence diagram are
The project member.
The time sheet form, which is the input form for the user. It displays the time report in editing mode, amongst other things.
The project object handles all functions associated with the project.
The time sheet object exposes functions to update the time sheet form.
So what happens in this scenario? The user wants to add a new project to the time sheet. He or she clicks the select project button, which makes the time sheet form call a function in the project object that retrieves all projects and subprojects for the current user. The user then selects a project and clicks the add project button. The time sheet form calls a function on the time sheet object that updates the form by adding a new row to the week report. The user can then add information to the row.
The next sequence diagram, shown in Figure 9-7, illustrates the flow when a user wants to remove a row from the weekly report.
The objects that participate in this sequence diagram are
The project member
The time sheet form
The time sheet object
This sequence occurs when a user wants to remove a row from the weekly report. The user selects the row to be deleted and clicks the remove project button. The time sheet form tells the time sheet object to remove the project row. The time sheet object removes the row and updates the form. The user then sees the updated form in his or her browser.
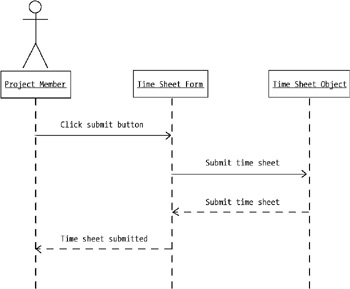
The last sequence diagram we are going to show you here demonstrates what happens when a user submits a report (see Figure 9-8).
The objects that participate in this sequence diagram are
The project member
The time sheet form
The time sheet object
When a user has finished editing a time report, he or she can submit it for approval by a manager. After editing the report, the user clicks the submit button on the time sheet form. The form then calls the time sheet object and asks it to submit the report. The time sheet object saves the report to an MSMQ queue and updates the form. The user is then redirected to the main page and is notified that the report has been saved.
As you saw in the UML discussion in Chapter 1, a class is a collection of objects with a common structure, behavior, and semantics. If you look at our example here, you can quite easily see that the reports have all these things in common, no matter which user submits them. So we can make a class to represent our weekly reports called WeekReport. Our users would probably have common characteristics, so User will make the second class. A third class is Projects, since they also have a lot of common denominators. We keep doing this until we are finished and cannot come up with any more classes.
To exemplify how we work with classes, we will focus on the three we just mentioned and see what they lead to. Unfortunately, we do not have enough room in this book to look at all the classes for our application. However, our examination of the User, Project, and WeekReport classes should give you an idea of how to approach class diagrams.
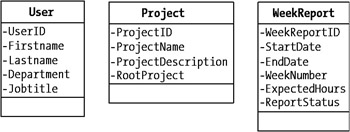
The first thing to do in designing class diagrams is go over the business requirements and see what attributes are needed for each of them. So in our case, which attributes might we desire for the user? UserID is one we want (we could also call it EmployeeID). Firstname and Lastname are two more. To keep it simple, we add only these other attributes: Department and Jobtitle. Then we continue doing this with the other two classes. Figure 9-9 shows the ones we have come up with.
| Note |
The RootProject attribute of the Project class is only filled if the project is a subproject to another project. |
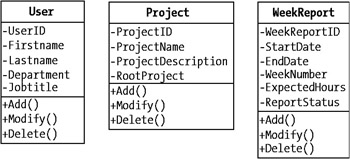
When we are satisfied with the attributes we have found, we continue with the operations, or behavior, of each class. All of these three classes will probably have at least three operations in common: add, delete, and modify. These three operations cover most of what we want to do, so we will stop here and add them to our model (see Figure 9-10). We could, of course, find many more, but that is not necessary for our example.
So now that we have attributes and operations for our classes, it is time to find the relationships between them.
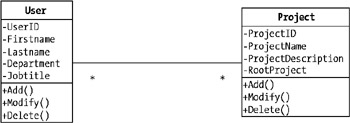
A user can work on many projects. There is nothing stopping this in our business rules, and in fact it is quite common in R & R Corporation. We also know that projects rarely have only one project member; instead, many members participate in a project. This is what would be described as a many-to-many relationship, and Figure 9-11 shows how this would be depicted in UML.
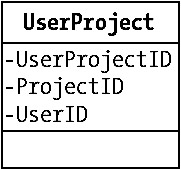
We want to split up a many-to-many relationship, since they are harder to implement. We do this by adding a middle class between the two so we get two one-to-many relationships instead. In this case, we would create a new class called UserProject (see Figure 9-12). We then add the attributes and operations we need for this new class.
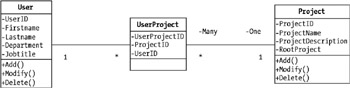
After the introduction of this class, we have new relationships between the classes (see Figure 9-13). One UserProject can only have one User and one UserProject can only belong to one Project. But a User can have many UserProjects, since he or she can participate in many projects. A Project can also belong to many UserProjects, since a project can have many members.
| Note |
You can also see that the same UserProject cannot belong to several Users, and the same UserProject cannot have more than one Project. |
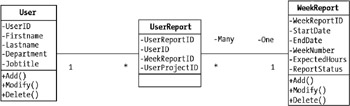
Let us continue with the relationship between User and WeekReport. A user can submit many WeekReports, since they report every week. Many Users can submit reports for the same week. As you can see, we have a many-to-many relationship here as well, and we need to split that up. This means we add a new class between the User and WeekReport classes. Hence we create a class called UserReport and add the relationships between the new class and the two old ones (see Figure 9-14).
Now one User can have many UserReports and one WeekReport can be part of many UserReports. We can never have a situation where one UserReport relates to many Users or where one UserReport is related to many WeekReports.
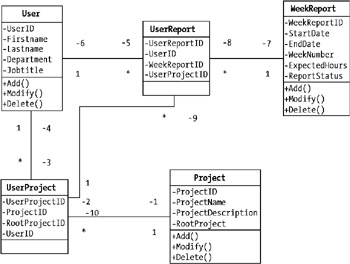
What you also can see in these classes that we have added is that we need a relationship between UserReport and UserProject. This is because all UserReports need to have an association to a Project, and it is UserProject we relate it to. In Figure 9-15 you see the total picture.
This procedure shows that mapping out relationships can be quite complex when we determine our classes. We started with three classes in this simple example but ended up with five due to the many-to-many relationships we found. Here we did not include any inheritance or aggregation either, so it could be more complicated.
When we are finished with defining our classes and the relationships between them, it is time to start designing the database.