


This topic describes the configuration requirements and procedure for debugging Java web servers such as JBOSS and Apache Tomcat in Enterprise Architect.
The procedure involves attaching to the process hosting the JVM from Enterprise Architect, as summarized below:
| 1. | Ensure binaries for the web server code to be debugged have been built with debug information. |
| 2. | Launch the server with the VM startup option described in this topic. |
| 3. | Import source code into the Enterprise Architect Model, or synchronize existing code. |
| 4. | Create or modify the Package Build Script to specify the Debug option for attaching to the process. |
| 5. | Set breakpoints. |
| 6. | Launch the client. |
| 7. | Attach to the process from Enterprise Architect. |
Server Configuration
The configuration necessary for the web servers to interact with Enterprise Architect must address the following two essential points:
| · | Any VM to be debugged, created or hosted by the server must have the Sparx Systems Agent SSJavaProfiler65 command line option specified in the VM startup option (that is: -agentlib:SSJavaProfiler5_70) |
| · | The CLASSPATH, however it is passed to the VM, must specify the root path to the package source files. |
The Enterprise Architect debugger uses the java.class.path property in the VM being debugged, to locate the source file corresponding to a breakpoint occurring in a class during execution. For example, a class to be debugged is called:
a.b.C
This is located at physical directory:
C:\source\a\b
So, for debugging to be successful, the CLASSPATH must contain the root path
c:\source.
See the following topics:
Package Script Configuration
Using the Debug tab of the Build Script dialog, create a script for the code you have imported and specify the following:
| · | In the Enter class name to debug field, type attach. |
| · | In the Use Debugger field, click on the drop-down arrow and select Java. |
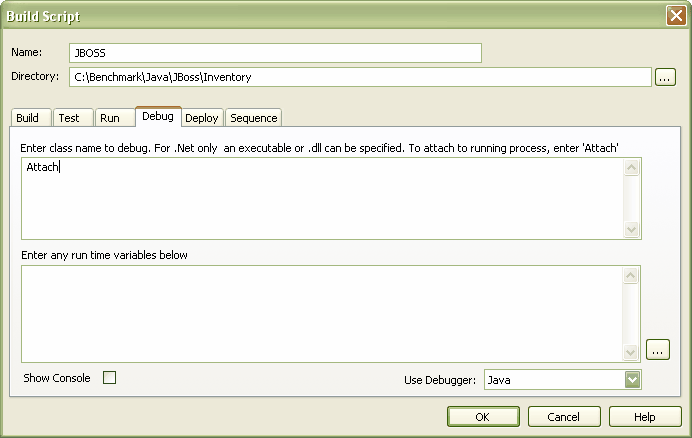
All other fields are unimportant. The Directory field is normally used in the absence of any class path property.
Debugging
First ensure that the server is running, and that the server process has loaded the Sparx Systems Agent DLL SSJavaProfiler5_70.DLL (use Process Explorer or similar tools to prove this).
Launch the client and ensure the client executes. This must be done before attaching to the server process in Enterprise Architect.
After the client has been executed at least once, return to Enterprise Architect, open the source code you imported and set some breakpoints.
Click on the Run Debugger button in Enterprise Architect. The Attach To Process dialog displays.
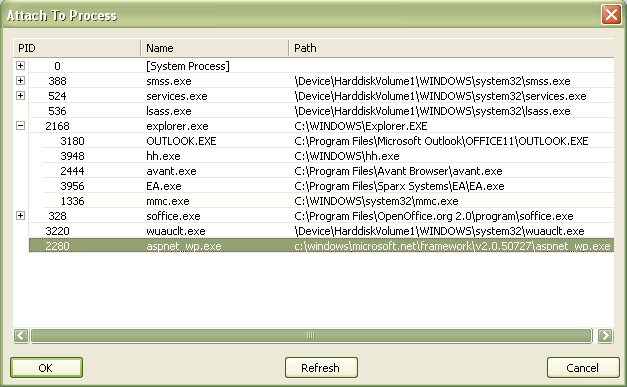
Click on the OK button. A confirmation message displays in the Debug Toolbar Output Tab window, stating that the process has been attached.
The breakpoints should remain enabled (bright red). If the breakpoints fail, and contain either an exclamation mark or a question mark, then either the process is not hosting the SSJavaprofiler5_70 Agent or the binaries being executed by the server are not based on the source code. If so, check your configuration.