


A Timing diagram defines the behavior of different objects within a time-scale. It provides a visual representation of objects changing state and interacting over time.
You can use Timing diagrams to define hardware-driven or embedded software components; for example, those used in a fuel injection system or a microwave controller. You can also use Timing diagrams to specify time-driven business processes.
Example Diagram
An example of a Timing diagram is shown below:
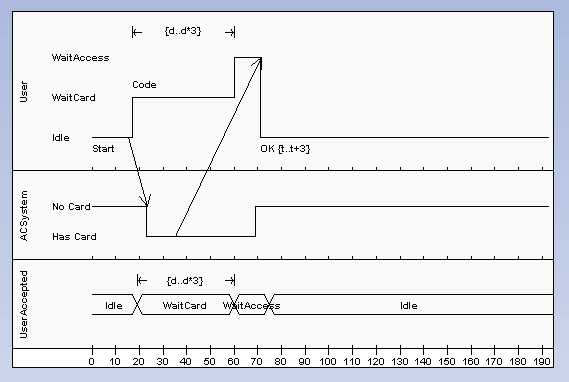
(See UML Superstructure Specification, v2.0, p. 454, figures 351and 352).
Create a Timing Diagram
| 1. | Right-click on a package in the Project Browser window. The context menu displays. |
| 2. | Select the Add | Add Diagram menu option. The New Diagram dialog displays. |
| 3. | In the Select From panel, select UML Behavioral. |
| 4. | In the Diagram Types panel, select Timing. |
| 5. | Click on the OK button. The Diagram screen displays, on which you create the Timing elements for the diagram. |
Toolbox Elements and Message
Select Timing diagram elements and connectors from the Timing pages of the Enterprise Architect UML Toolbox.
Tip: Click on the elements and message below for more information.
Timing Diagram Elements |
Timing Diagram Message |
|
|
|
|
|
|
|
|
|
|
See Also
OMG UML Specification
The OMG UML specification (UML Superstructure Specification, v2.0, p. 450) states:
"Timing Diagrams are used to show interactions when a primary purpose of the diagram is to reason about time. Timing diagrams focus on conditions changing within and among Lifelines along a linear time axis. Timing diagrams describe behavior of both individual classifiers and interactions of classifiers, focusing attention on time of occurrence of events causing changes in the modeled conditions of the Lifelines."
The OMG UML specification (UML Superstructure Specification, v2.0, p. 453) also states:
"The primary purpose of the timing diagram is to show the change in state or condition of a lifeline (representing a Classifier Instance or Classifier Role) over linear time. The most common usage is to show the change in state of an object over time in response to accepted events or stimuli. The received events are annotated as shown when it is desirable to show the event causing the change in condition or state."