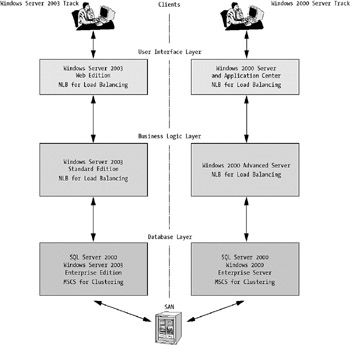
For our time reporting application, there are mainly two tracks to follow regarding platform: either Windows 2000 Server or Windows Server 2003. Figure 9-24 shows the two in a side-by-side comparison.
Before making our decision regarding which track to take, we are going to look at a few performance tests that will help us make the right decision.
In mid-2003, Microsoft published a document called "Visual Basic .NET on Windows Server 2003: A New Benchmark" (http://msdn.microsoft.com/library/default.asp?url=/library/en-us/dnbda/html/ws03perfbench.asp). In it, Microsoft compared an application running on Windows NT 4.0 Enterprise Edition, Windows 2000 Advanced Server, and Windows Server 2003. The application was written in Visual Basic 6 and Visual Basic .NET. We will focus only on the Visual Basic .NET benchmarks here because VB 6 is not an option in our solution. This also means we will not discuss the NT 4.0 benchmarks either, because .NET is not supported on this platform.
The benchmark tests shown in Figure 9-25 clearly indicate that a .NET application on Windows Server 2003 outperforms the same application on a Windows 2000 platform. This comes as no surprise to us, since this is what we have noticed in our own projects. What is more interesting is that the .NET Framework 1.1 offers a significant performance boost compared to version 1.0 on both operating systems.
The tests show that the best Windows 2000 benchmark only achieves 55 percent of the transactions per second that the best Windows Server 2003 provides. That is a good argument for choosing Windows Server 2003 as a platform for building applications.
Since we never trust these kinds of benchmarks without trying them ourselves, we decided to rerun the tests in our own lab. Would we see the same or higher difference ourselves or would it be less?
We decided to do the tests in VMware 4 on our workstation first just to get a feel for how the results would be. VMware graciously provided us with licenses to its virtual machine software so we could avoid buying expensive hardware for these tests.
Since we also wanted to try this in a real environment, we turned to Dell Sweden and asked if they could help. This way we had a chance to run more extensive tests. Fortunately they not only allowed us time in the lab, but also granted us professional help through their technicians as well. In Appendix A, we show a complete list of the hardware made available to us by Dell.
We decided to do two test runs of our own:
Replicate the tests in VMware on our own machine.
Replicate the tests in the Dell test lab.
As an option, we thought it would be a great idea to try one of our own applications in the Dell lab if time permitted.
We also decided to only test version 1.1 of the .NET Framework, since that is the version we use daily anyway.
The VMware tests were run on a Compaq Presario 8000 workstation with a 2.2 GHz CPU and 768MB RAM. We used VMware to create our virtual servers.
The database server was the same for both scenarios: a Windows Server 2003 Standard Edition running SQL Server 2000 Developer Edition SP3. We installed the database with the scripts Microsoft provides for the test application, and then inserted some data with other scripts.
For our application servers, we used two virtual servers—Windows Server 2003 Standard Edition in scenario one, and Windows 2000 Server in scenario two. This way we tried to have versions that were as equal as possible from the two server families. They both included Visual Studio .NET 2003 Enterprise Architect with .NET Framework 1.1. We also made sure all the latest available patches were installed. We then installed the application according to Microsoft's installation instructions.
On our client computer, we used Application Center Test (ACT), a tool in Visual Studio 2003 Enterprise Architect, to create a test script. The script was created by recording navigation in the test Web application, through which we pretended to purchase some books, and then logged out.
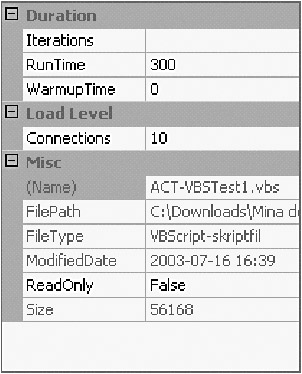
Since we used a VMware solution, everything really ran on the same computer. We hence decided to limit the number of simulated connections, so we set this value to 10 (see Figure 9-26). All test runs were 300 seconds long.
We were then ready to do some testing. We started the database server, and then we started the Windows Server 2003 application server. When they were both up and running and we had verified that the application worked, we started the first test run.
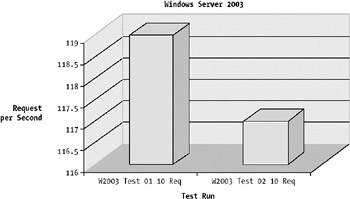
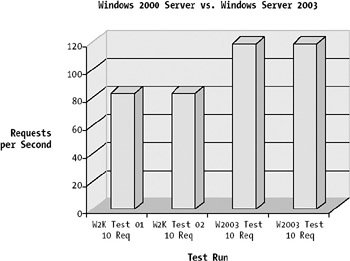
When the test was finished, we found that we had managed to get 119 requests per second. The total number of requests was 35,764. We received no HTTP or socket errors. We ran the test again, and the results were similar (see Figure 9-27)—117 requests per second and no errors.
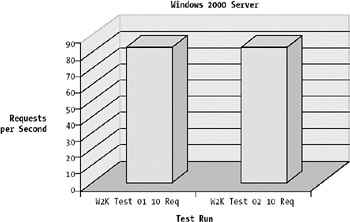
We then shut down the application server and started the Windows 2000 one instead. When we had verified that the application worked on this platform too, we ran two sets exactly like the ones just shown. The results were a bit different (see Figure 9-28). We managed to get 83 requests per second, but close to 900 HTTP errors and nearly 20,000 socket errors on the exact same hardware.
The windows 2000 platform managed 70 percent of the requests per second that the Windows Server 2003 did (see Figure 9-29).
We ran the test ten more times on each platform, but the results were the same, give or take a few requests per second. Next we decided to lower the number of simulated connections to five instead of ten and see if the results were any different. The results were not much different in the outcome (see Figure 9-30). The Windows 2000 virtual server managed 80 requests per second, which was 74 percent of what the other platform managed. To be certain of our results, we ran the tests ten more times on each platform, but nothing significant changed.
Now we could not wait to get to the Dell test lab and run the tests on some "real" hardware, which would allow us to increase the load on the test system.
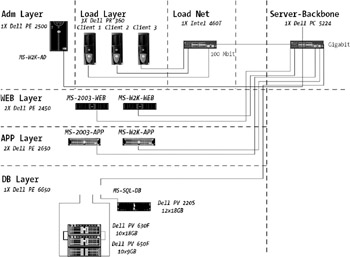
The equipment that Dell provided us is shown in Figure 9-31 (a detailed list of this hardware appears in Appendix A). We were very happy to be able to run our tests on this hardware. Since running virtual machines always costs performance because they all are running on the same physical machine, we were curious to see if the results would be the same on real hardware.
The first thing we decided to do was to run the exact same tests as we did in VMware. That was our most important task during the days we had access to the lab.
Here is a closer look at what systems we had available to test on:
The database server was the same for all tests, a Dell PE 6650.
The application servers were Dell PE 2650 machines. One of them ran Windows 2000 Enterprise Server, and the other ran Windows Server 2003 Advanced Edition.
The Web servers were Dell PE 2450 machines. One of them ran Windows 2000 Standard Server, and the other Windows Server 2003 Web Edition.
The three clients all were Dell PR 360 computers running Windows XP Professional.
We also had an Active Directory Server running Windows 2000 Server. The machine on which this occurred was a Dell PE 2500.
One of the first things we became aware of at Dell was that ACT did not support multiple test clients. That meant we could not load balance the requests on multiple clients like we could in ACT's predecessor, the Web Application Stress Tool. Since the Web Application Stress Tool could do this easily, we really expected ACT to do the same. After several phone calls to our contacts at Microsoft, we were informed that the full version of ACT should be a part of Application Center Server. Alas, to install the server the clients needed to be running at least Windows 2000 Standard Server, and ours ran Windows XP Professional. So we could not verify this unfortunately, and we did not have enough time to reinstall the clients. Instead, we had to find another way to accomplish the same thing. The question we asked ourselves was why Microsoft had chosen to limit ACT this way. We still do not know the answer.
What we finally did was we used the same scripts on each of our three clients and started them simultaneously. We could perhaps become unsynced by a second here and there, but we had no choice if we were going to put a heavy load on our servers.
The script we used was recorded the exact same way we did on the VMware tests. We started out with only three connections on each client, a total of nine connections against the server. The duration of the tests was five minutes for each test run. Then we ran the tests five times against both application servers.
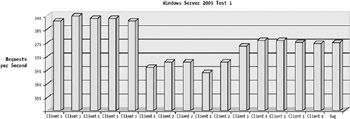
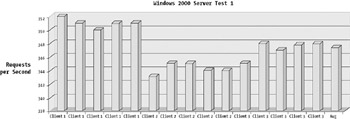
The results were almost the same on every client. We did see that client 1 achieved slightly more requests per second than the others did, but this was due to a better CPU on that machine. In Figure 9-32, you can see the results for each client on the Windows Server 2003 platform, and in Figure 9-33 you can see the Windows 2000 Server results.
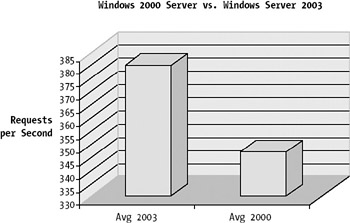
When we ran the Windows 2000 Server tests, each client managed to get an average of 347 requests per second; on Windows Server 2003, the result was 380 requests per second (see Figure 9-34). This meant that Windows 2000 Server managed 91 percent of the requests that Windows Server 2003 did. We had actually expected the difference to be larger, but so far the load was moderate.
We raised the number of connections on each client to eight, and ran the tests for 60 minutes. We did this once for each application server. Now the difference between the two operating systems began to show. Windows 2000 only managed 87 percent of the requests per second that Windows Server 2003 did (see Figure 9-35).

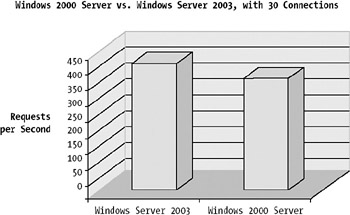
To see if we could find more of a difference between the platforms, we slowly increased the number of connections until we reached 30 connections on each client. This means we had 90 simultaneous connections to the servers.
What we saw clearly during this test was that Windows 2000 showed virtually no signs of being able to increase the number of requests per second it could handle. Windows Server 2003, on the other hand, handily served the increased load without giving up. As Figure 9-36 shows, Windows 2000 still handled 347 requests per second, whereas Windows Server 2003 averaged 417.
| Note |
During these live tests, the error count was close to zero on each platform. Based on this, we conclude that we should be careful with using VMware as a test application for stress tests. It is preferable to use real hardware for these types of tests. |
We ran a few more tests after this, but our conclusions did not change. Windows 2000 simply could not handle an increasing load, whereas Windows Server 2003 could. This was as we expected, so we were not surprised.
After these tests, we are certain of our decision on which platform to choose. Figure 9-37 shows how we will design the platform, and as you can see, we have decided to go with the Windows Server 2003 track. However, we understand that it is not always easy to choose a new operating system as a platform. In a large enterprise, many people have a say in decisions, and policies rule platform choices. In our fictitious company, we do not have to bother with such politics. We are free to do what we want, so we continue with the 2003 platform.
Our Web servers, which provide the ASP.NET pages the users access, will all run Windows Server 2003 Web Edition. They will be load balanced with Network Load Balancing. At first we will start with five servers, but during our stress testing we will evaluate how many we actually need, so this figure is a bit uncertain at this point.
The application layer will run Windows Server 2003 Standard Edition, and we will use NLB to load balance these, too. We can use NLB since it exposes the business logic as Web services, and hence use the IIS to host the logic.
The database servers will run Windows Server 2003 Enterprise Edition. We did not choose the Datacenter Edition because our application does not need the kind of power that edition provides. We will build a two-node cluster with the help of Microsoft Cluster Service, and have one active and one passive node. They will each have at least four CPUs and 4GB of RAM. We will examine during testing if this is a good setup or if we need to change the hardware. The data and the log files will be stored on the SAN, where we can provide good performance, a reliable environment, and also great back-up capabilities. The SAN will be accessed through Windows Storage Server 2003.